Welcome to the Building Geospatial Multi-Lay Apps with Snowflake and Streamlit quickstart. Today you will learn how to analyse and transform geospatial data in Snowflake. You will be using Ordnance Survey open datasets available on the marketplace as well as the worldwide open overture buildings dataset provided by CARTO.


This is a progressive learning experience from viewing points on a mapk right through to building a multi layer app - which pulls together buildings with unique property reference numbers, the road network and urban extents.
You will be covering:
- Geospatial datatypes and formats
- Points, Linestrings and Polygons
- H3
- Spatial Joins and Calculations
- Visualising the results using Pydeck
- Search Optimisation
- Building a multi-layer app - which pulls together everything you have learned.
- Using what you have learnt to create a solar power what if scenario calculator. This combines Roofing data and solar elevation data supplied by the Met Office
Thoughout the experience, you will demonstrate the concepts with Snowflake Notebooks and Streamlit.
Structure of the session
The Lab consists of three notebooks and two Streamlit applications.
- Completion of the (ANALYSE_LOCATION_DATA) notebook.This is an end-to-end tour on how location data works with Snowflake
- Creating a Streamlit app ROAD_NETWORKThis is an example Streamlit application which brings together the different techniques learnt in notebook 1.
What You Will Learn
- An understanding of geospatial data types and formats - and how this works in Snowflake
- An understanding of Snowflakes built in H3 capabilities
- Spatial Joins
- Geospatial Calculations
- Geospatial Filtering
- Using Search Optimisation to speed up geospatial queries
- Visualing points, linestrings and polygons on a multi layered map using Pydeck - all within a Streamlt application
What You'll Build
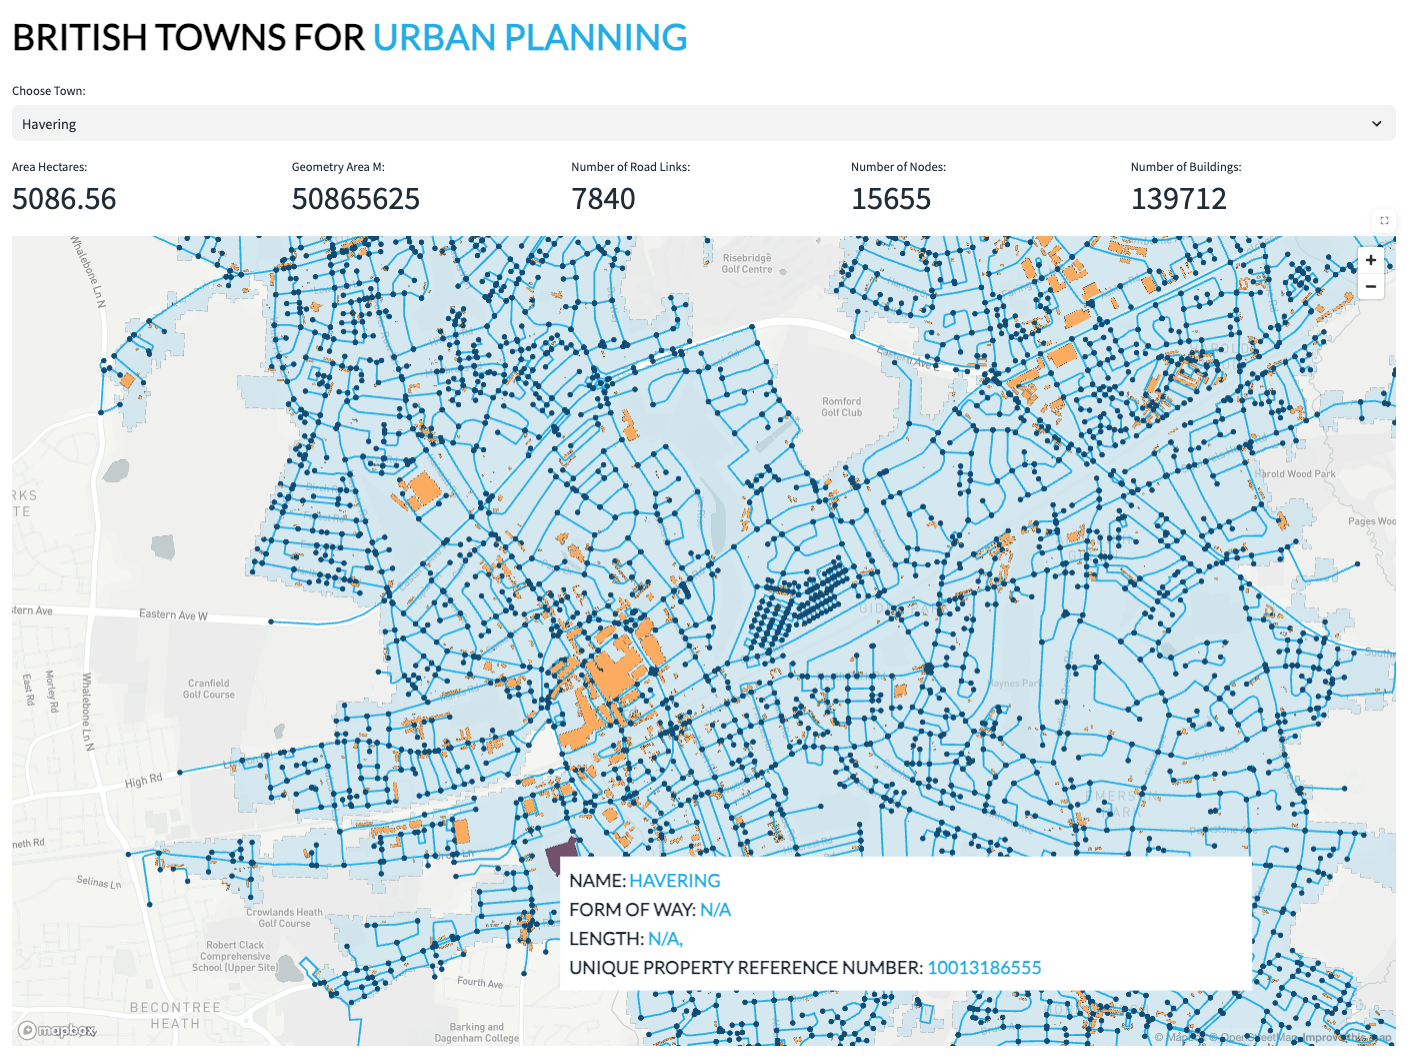
- A streamlit application to visualise the UK road network together with buildings - which uses Ordnance survey road network data and the Carto Overture maps buildings dataset.
Prerequisites
- A Snowflake Account. Sign up here for a free 30 day trial.
Open up a new SQL worksheet and run the following commands. To open up a new SQL worksheet, select Projects » Worksheets, then click the blue plus button and select SQL worksheet.
CREATE DATABASE IF NOT EXISTS ANALYSE_LOCATION_DATA;

CREATE WAREHOUSE IF NOT EXISTS LOCATION_ANALYTICS;

CREATE SCHEMA IF NOT EXISTS NOTEBOOK;
CREATE SCHEMA IF NOT EXISTS STREAMLIT;
CREATE SCHEMA IF NOT EXISTS DEFAULT_SCHEMA;
ALTER ACCOUNT SET CORTEX_ENABLED_CROSS_REGION = 'ANY_REGION';

CREATE OR REPLACE WAREHOUSE XX_LARGE_HEAVY_LIFT
WITH
  WAREHOUSE_SIZE = '2X-LARGE'
  AUTO_SUSPEND = 60
  AUTO_RESUME = TRUE
  INITIALLY_SUSPENDED = TRUE;
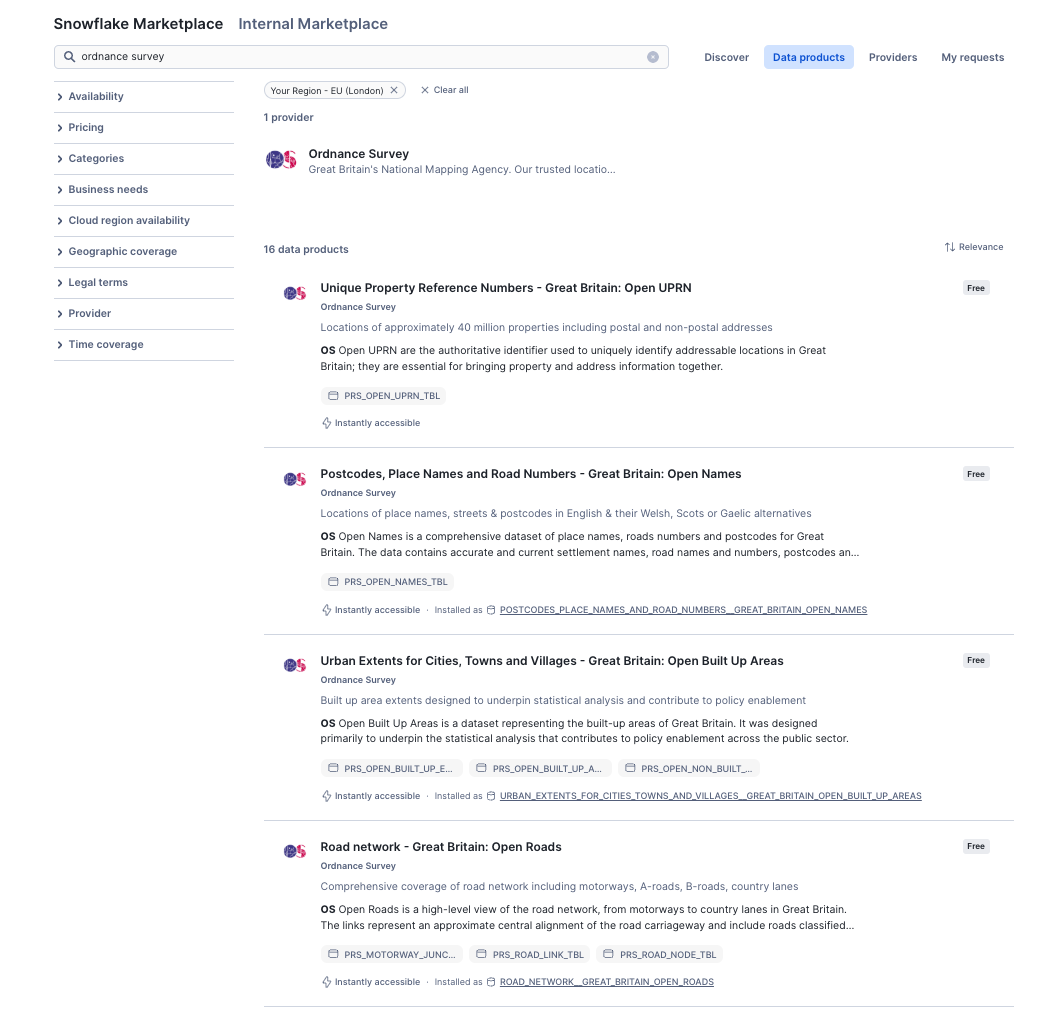
- From the home page Navigate to Data Products » Marketplace
Ordnance Survey Datasets
- In the search box provided, search for the following datasets:
- Ordnance Survey - Urban Extents for Cities, Towns and Vilages
- Ordnance Survey - Postcodes, Place Names and Road Names
- Ordnance Survey - Road Network Great Britain - Open Roads
- Ordnance Survey - Unique Property Reference Numbers - Great Britain: Open UPRN
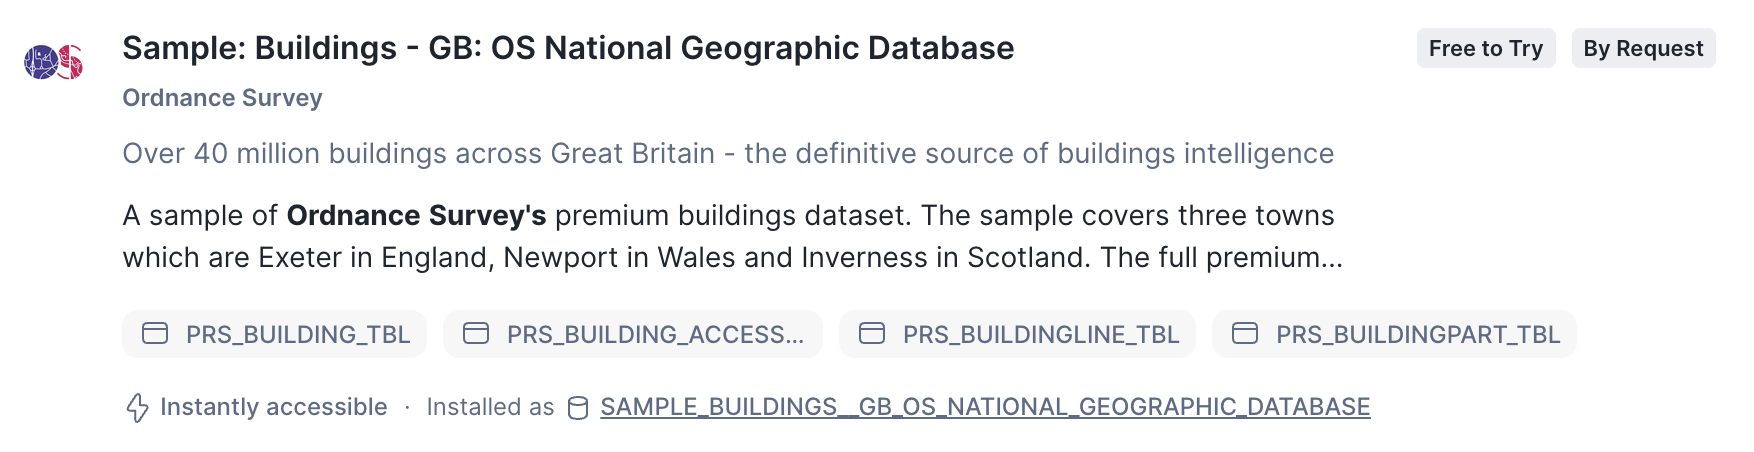
- Ordnance Survey - GB: GB: OS National Geographic Database
Met Office Dataset
- Search for Met office and install the following dataset:
- Postcode Sector Weather Forecasts
- For each dataset found, press Get to get the data.
- Follow the on screen prompts to install each dataset.
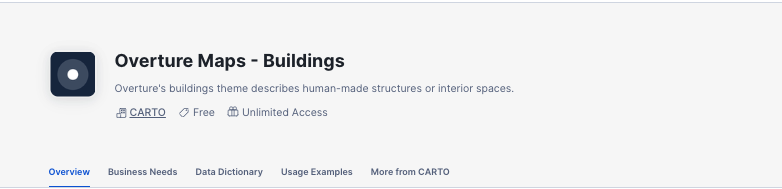
Carto Datasets - Obtain the following datasets from the marketplace
This dataset provides sample building polygons all over the world.
- Carto - Overture Maps Buildings
Are you ready to start learning about location data in Snowflake?
This tutorial will take you through how you can use location data to perform spatial calculations, joins, and visualise the data using the popular Pydeck python package. We will be using the freely available datasets which you have now installed to step through examples of how geospatial data can be handled.
- Click here to download notebook
- From the home page, navigate to Projects > Notebooks
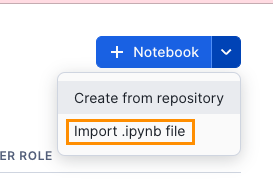
- Import the notebook as a new Snowflake Notebook
- Choose LOCATION_ANALYTICS as the database and Notebooks as the schema
- Choose LOCATION_ANALYTICS as the query warehouse
- Name the notebook ANALYSE_LOCATION_DATA
- Before you start the notebook, click on packages and import the Pydeck package
- Press Start to initialise the notebook and follow the instructions within the notebook.
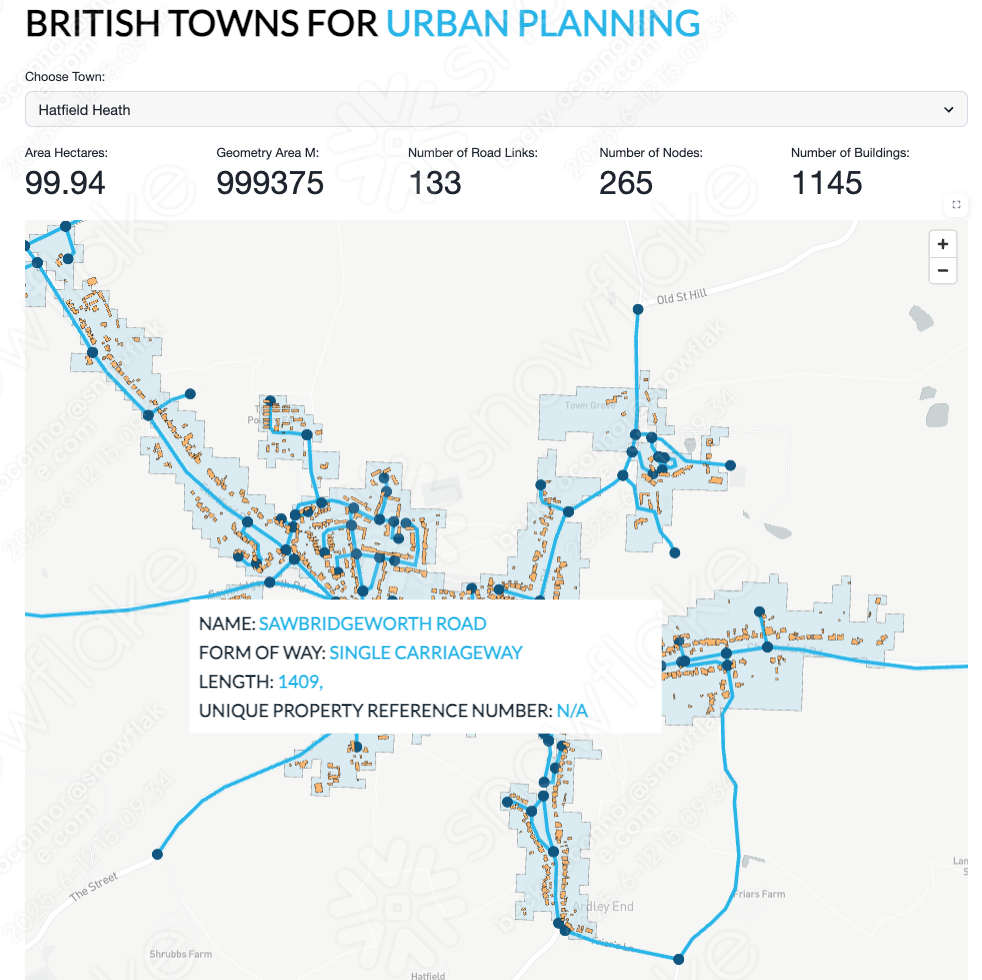
This app gives you an example of how you can bring all these datasets together to form a multi layered mapping visual.
- Navigate to Projects > Streamlit
- Create a new streamlit application and call the application URBAN_PLANNING inside the LOCATION_ANALYTICS database and the STREAMLITS schema
- Delete all sample code and import the pydeck package by clicking on packages on the top left hand corner of the screen.
- copy and paste the following code into the Streamlit canvas from here
You will add a selection of supporting files for the app. In this example, you will import a logo, a style sheet and create a config.toml file. All of which provide additional styling to the app.
Download and the following Style Sheet and add to the app directory. The app directory is located in the side pane under the Files tab.
To add a file, you will need to click on the + and select upload from local.
Browse to the downloaded file and upload.
Download the following Logo and add to the app directory in the same way as previously.
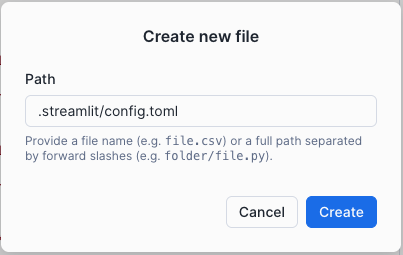
- Click on the + and select Create new file and call it .streamlit/config.toml
- Navigate to view the content of the newly created empty file, and copy and paste the content from the following file - config.toml
The following notebook will leverage building data from the UK Nationall Geographic database. You will combine this with historic solar elevation data in order to determine what solar power could be generated from these buildings.
- Click here to download notebook
- From the home page, navigate to Projects > Notebooks
- Import the notebook as a new Snowflake Notebook
- Select ANALYSE_LOCATION_DATA as the database and STREAMLIT as the schema.
- Select LOCATION_ANALYTICS as the compute
- Press Create
- Before you start the notebook, click on packages and import the Pydeck package
- Press Start to initialise the notebook and follow the instructions within the notebook.
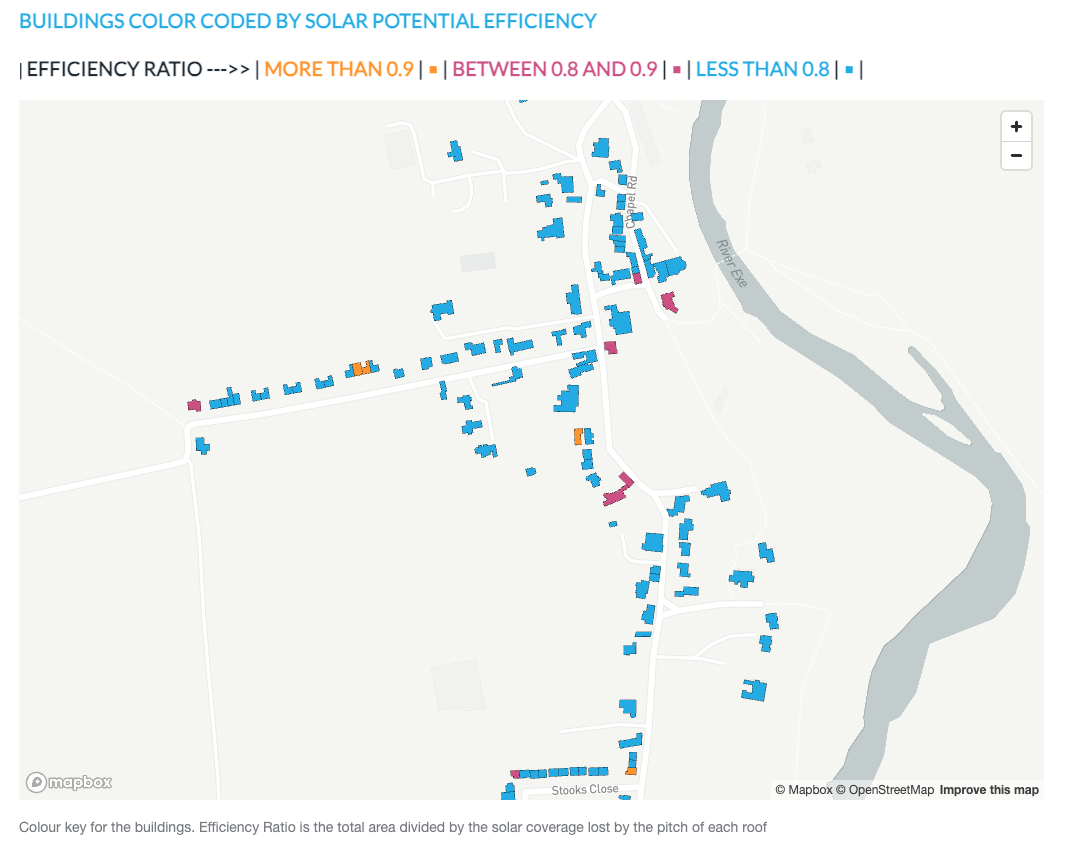 The following streamlit will allow you to visualise the buildings within any urban extent that has available sample building data to understand the potential solar radiation.
- Navigate to Projects > Streamlit
- Create a new streamlit application and call the application SOLAR_POWER_INSIGHTS inside the LOCATION_ANALYTICS database and the STREAMLITS schema
- Select LOCATION_ANALYTICS as the application warehouse.
- Delete all sample code and import the pydeck package by clicking on packages on the top left hand corner of the screen.
- Press Create
- Copy and paste the following code into the Streamlit canvas from here
- Download and the following Style Sheet and add to the app directory.
Download the following Logo and add to the app directory
- Create new file and call it .streamlit/config.toml
- Navigate to view the content of the newly created empty file, and copy and paste the content from the following file - config.toml
Run the app
You will be able to select an urban area which will give you summary details as well as the buildings information. Each building is color coded based on the level of potential energy efficiency.
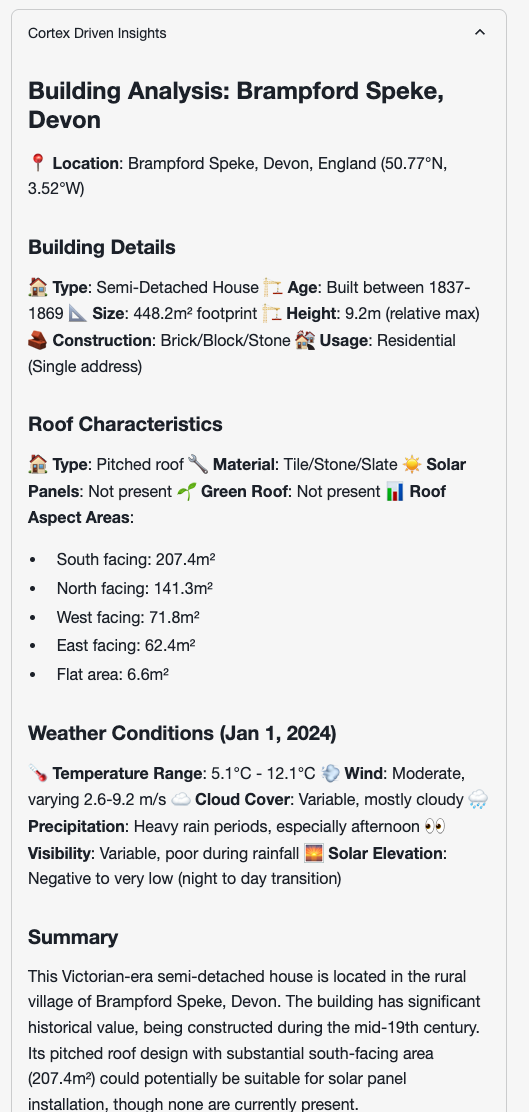
the side bar will give you more information about the buildings and weather in the selection.
You will note that when you Run Cortex it leverages the Anthropic LLM which gives you written analysis about the building with the most potential.
Conclusion
Congratulations on completing the Building Geospatial Multi-Layer Apps with Snowflake and Streamlit Quickstart! Throughout this session, you've explored how Snowflake can be used to analyze and transform geospatial data, combining multiple datasets to generate valuable insights.
What You Learned
- Fundamentals of Geospatial Analysis in Snowflake
You started by learning how to work with location data in Snowflake, visualizing points on a map and understanding spatial relationships. - Building a Multi-Layer Application
Using Streamlit, you explored how to bring together different layers of geospatial information into an interactive application. - You have applied the above techniques to generate a solar panel insights app
Next Steps
With this foundational knowledge, you can extend your analyses by:
- Integrating additional external datasets, such as demographic or economic data, to enhance decision-making.
- Experimenting with different visualization techniques to improve data storytelling.
- Automating geospatial data processing with Snowpark and external APIs.
We hope this hands-on lab has provided you with the confidence and skills to apply geospatial analytics in your own projects. Happy analyzing! 🚀