By completing this guide, you will be able to try Snowpark for Python all from within the Snowflake UI. At the end, you'll have a better understanding of how to perform core data engineering tasks using Snowpark in Snowflake Python Worksheet.
What is Snowpark?
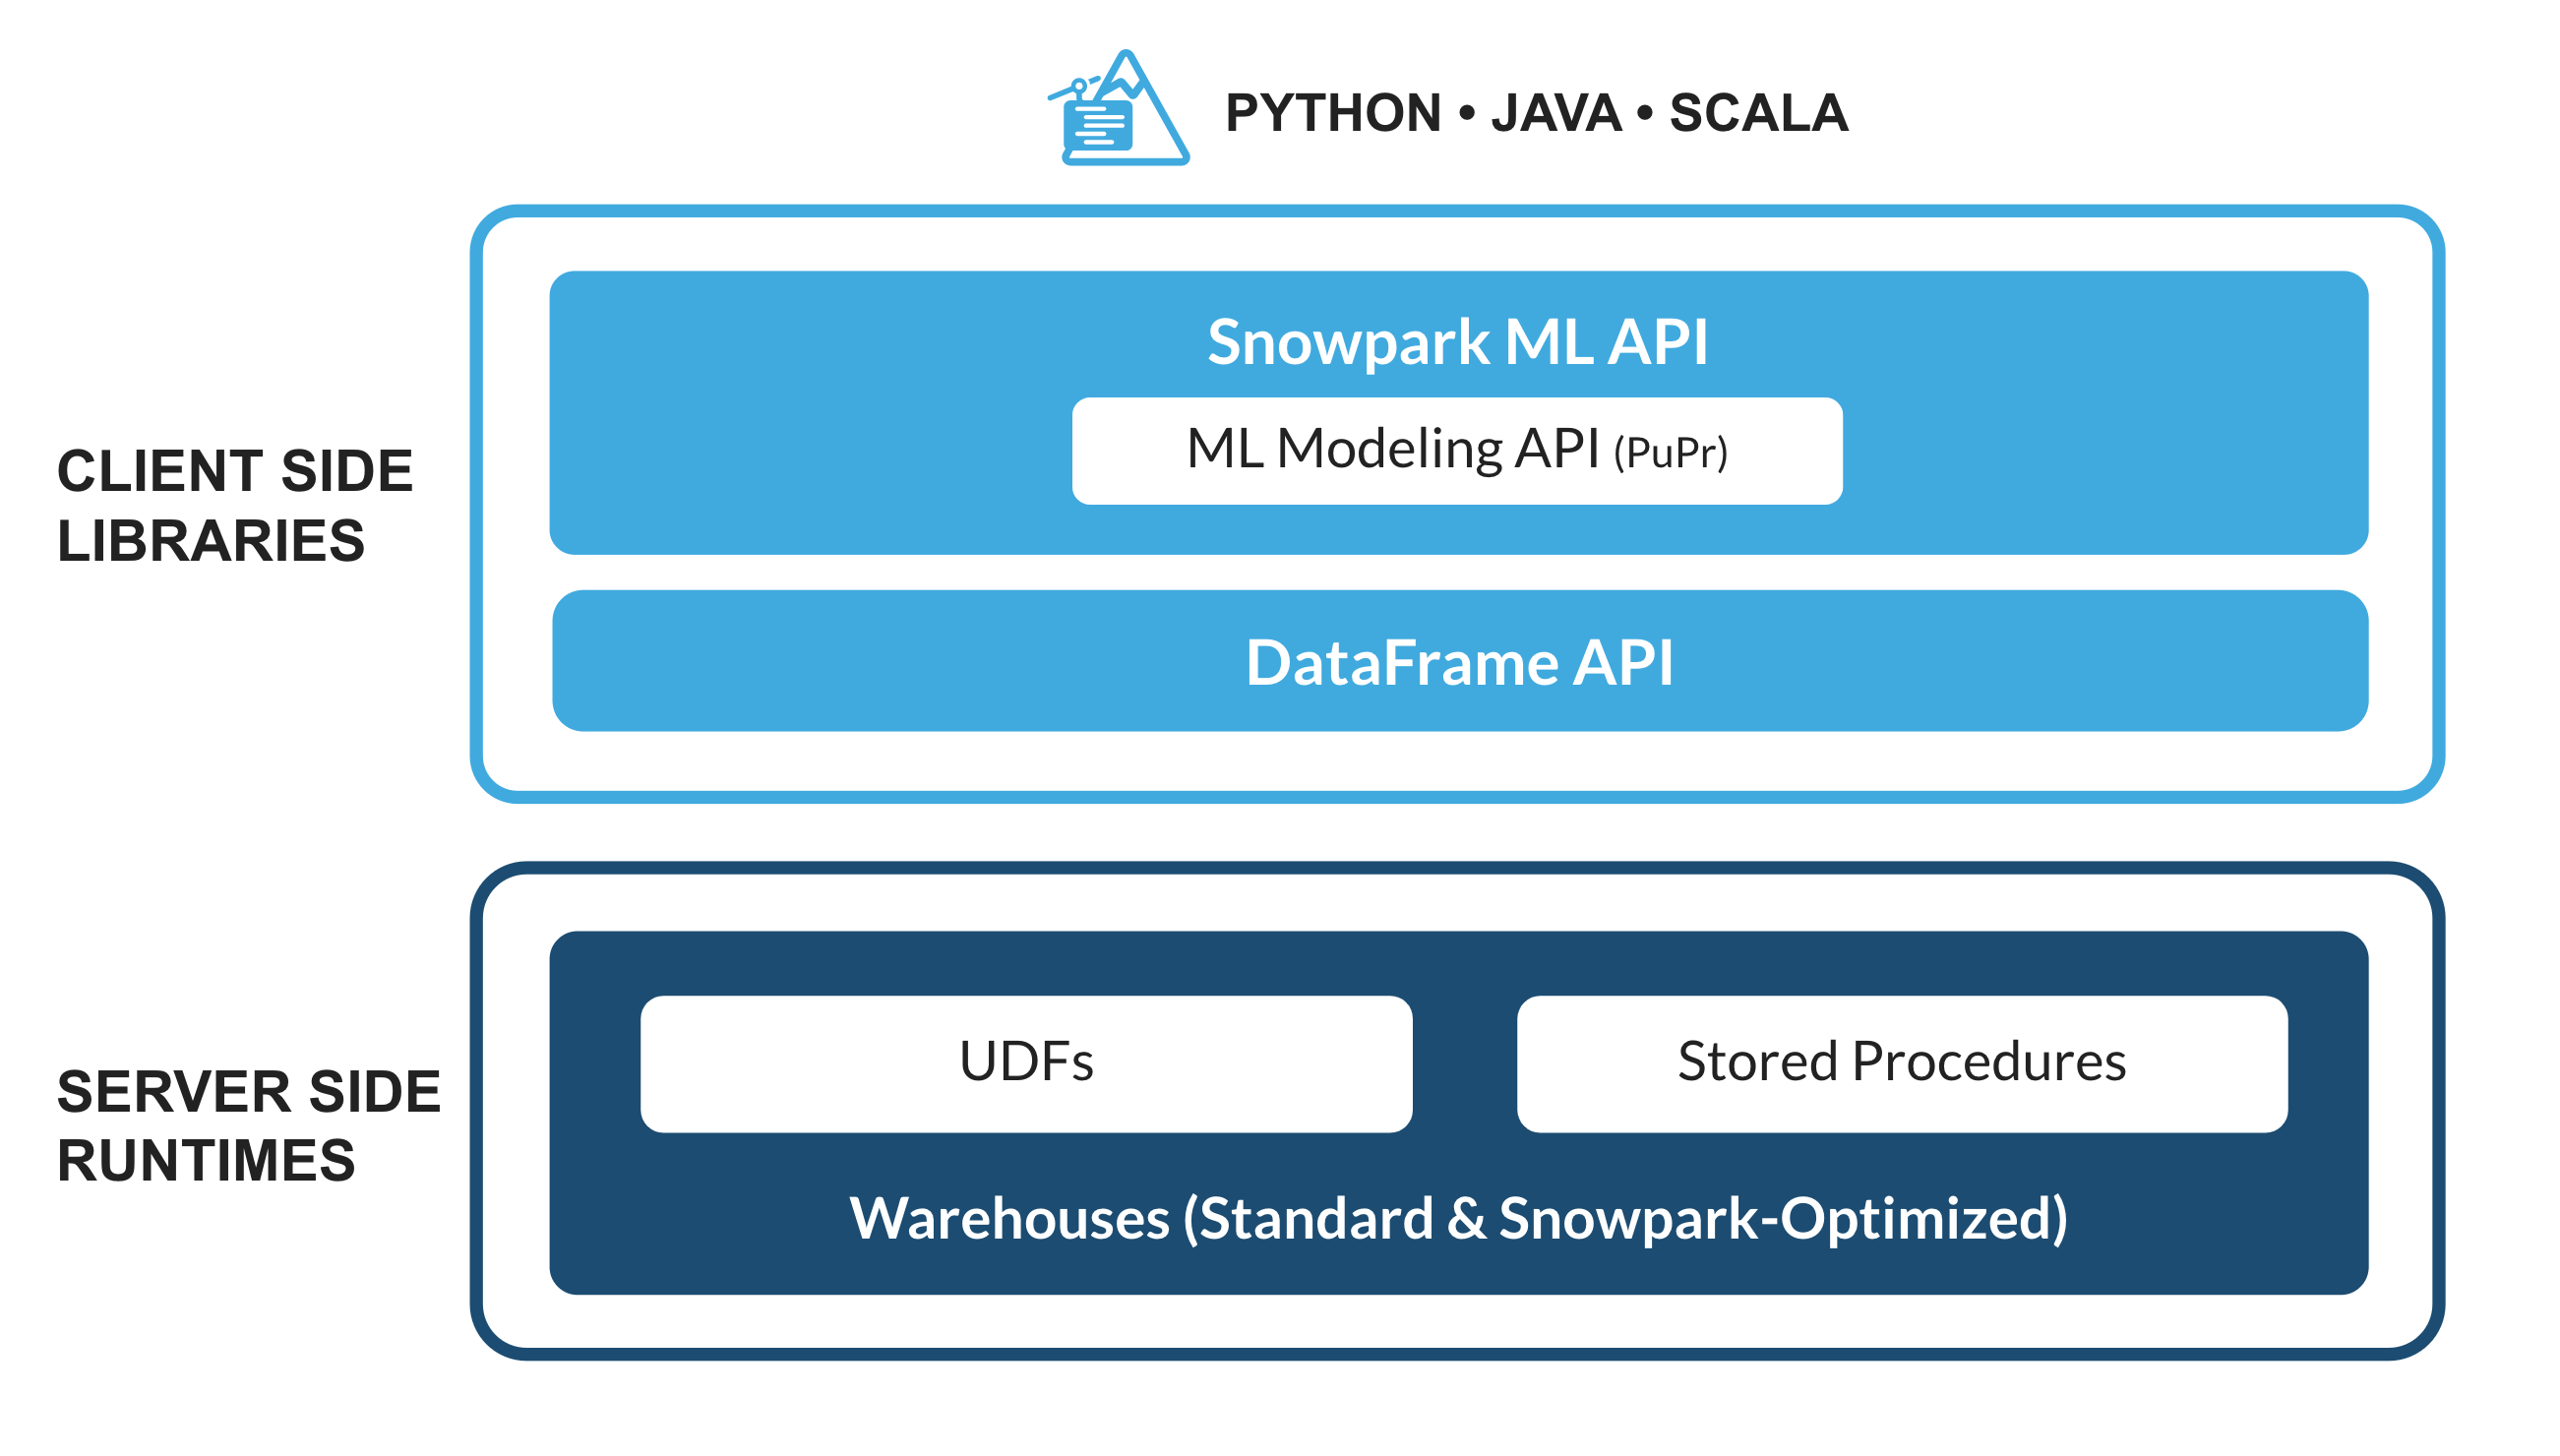
The set of libraries and runtimes in Snowflake that securely deploy and process non-SQL code, including Python, Java and Scala.
Familiar Client Side Libraries - Snowpark brings deeply integrated, DataFrame-style programming and OSS compatible APIs to the languages data practitioners like to use. It also includes the Snowpark ML API for more efficient ML modeling (public preview) and ML operations (private preview).
Flexible Runtime Constructs - Snowpark provides flexible runtime constructs that allow users to bring in and run custom logic. Developers can seamlessly build data pipelines, ML models, and data applications with User-Defined Functions and Stored Procedures.
Learn more about Snowpark.
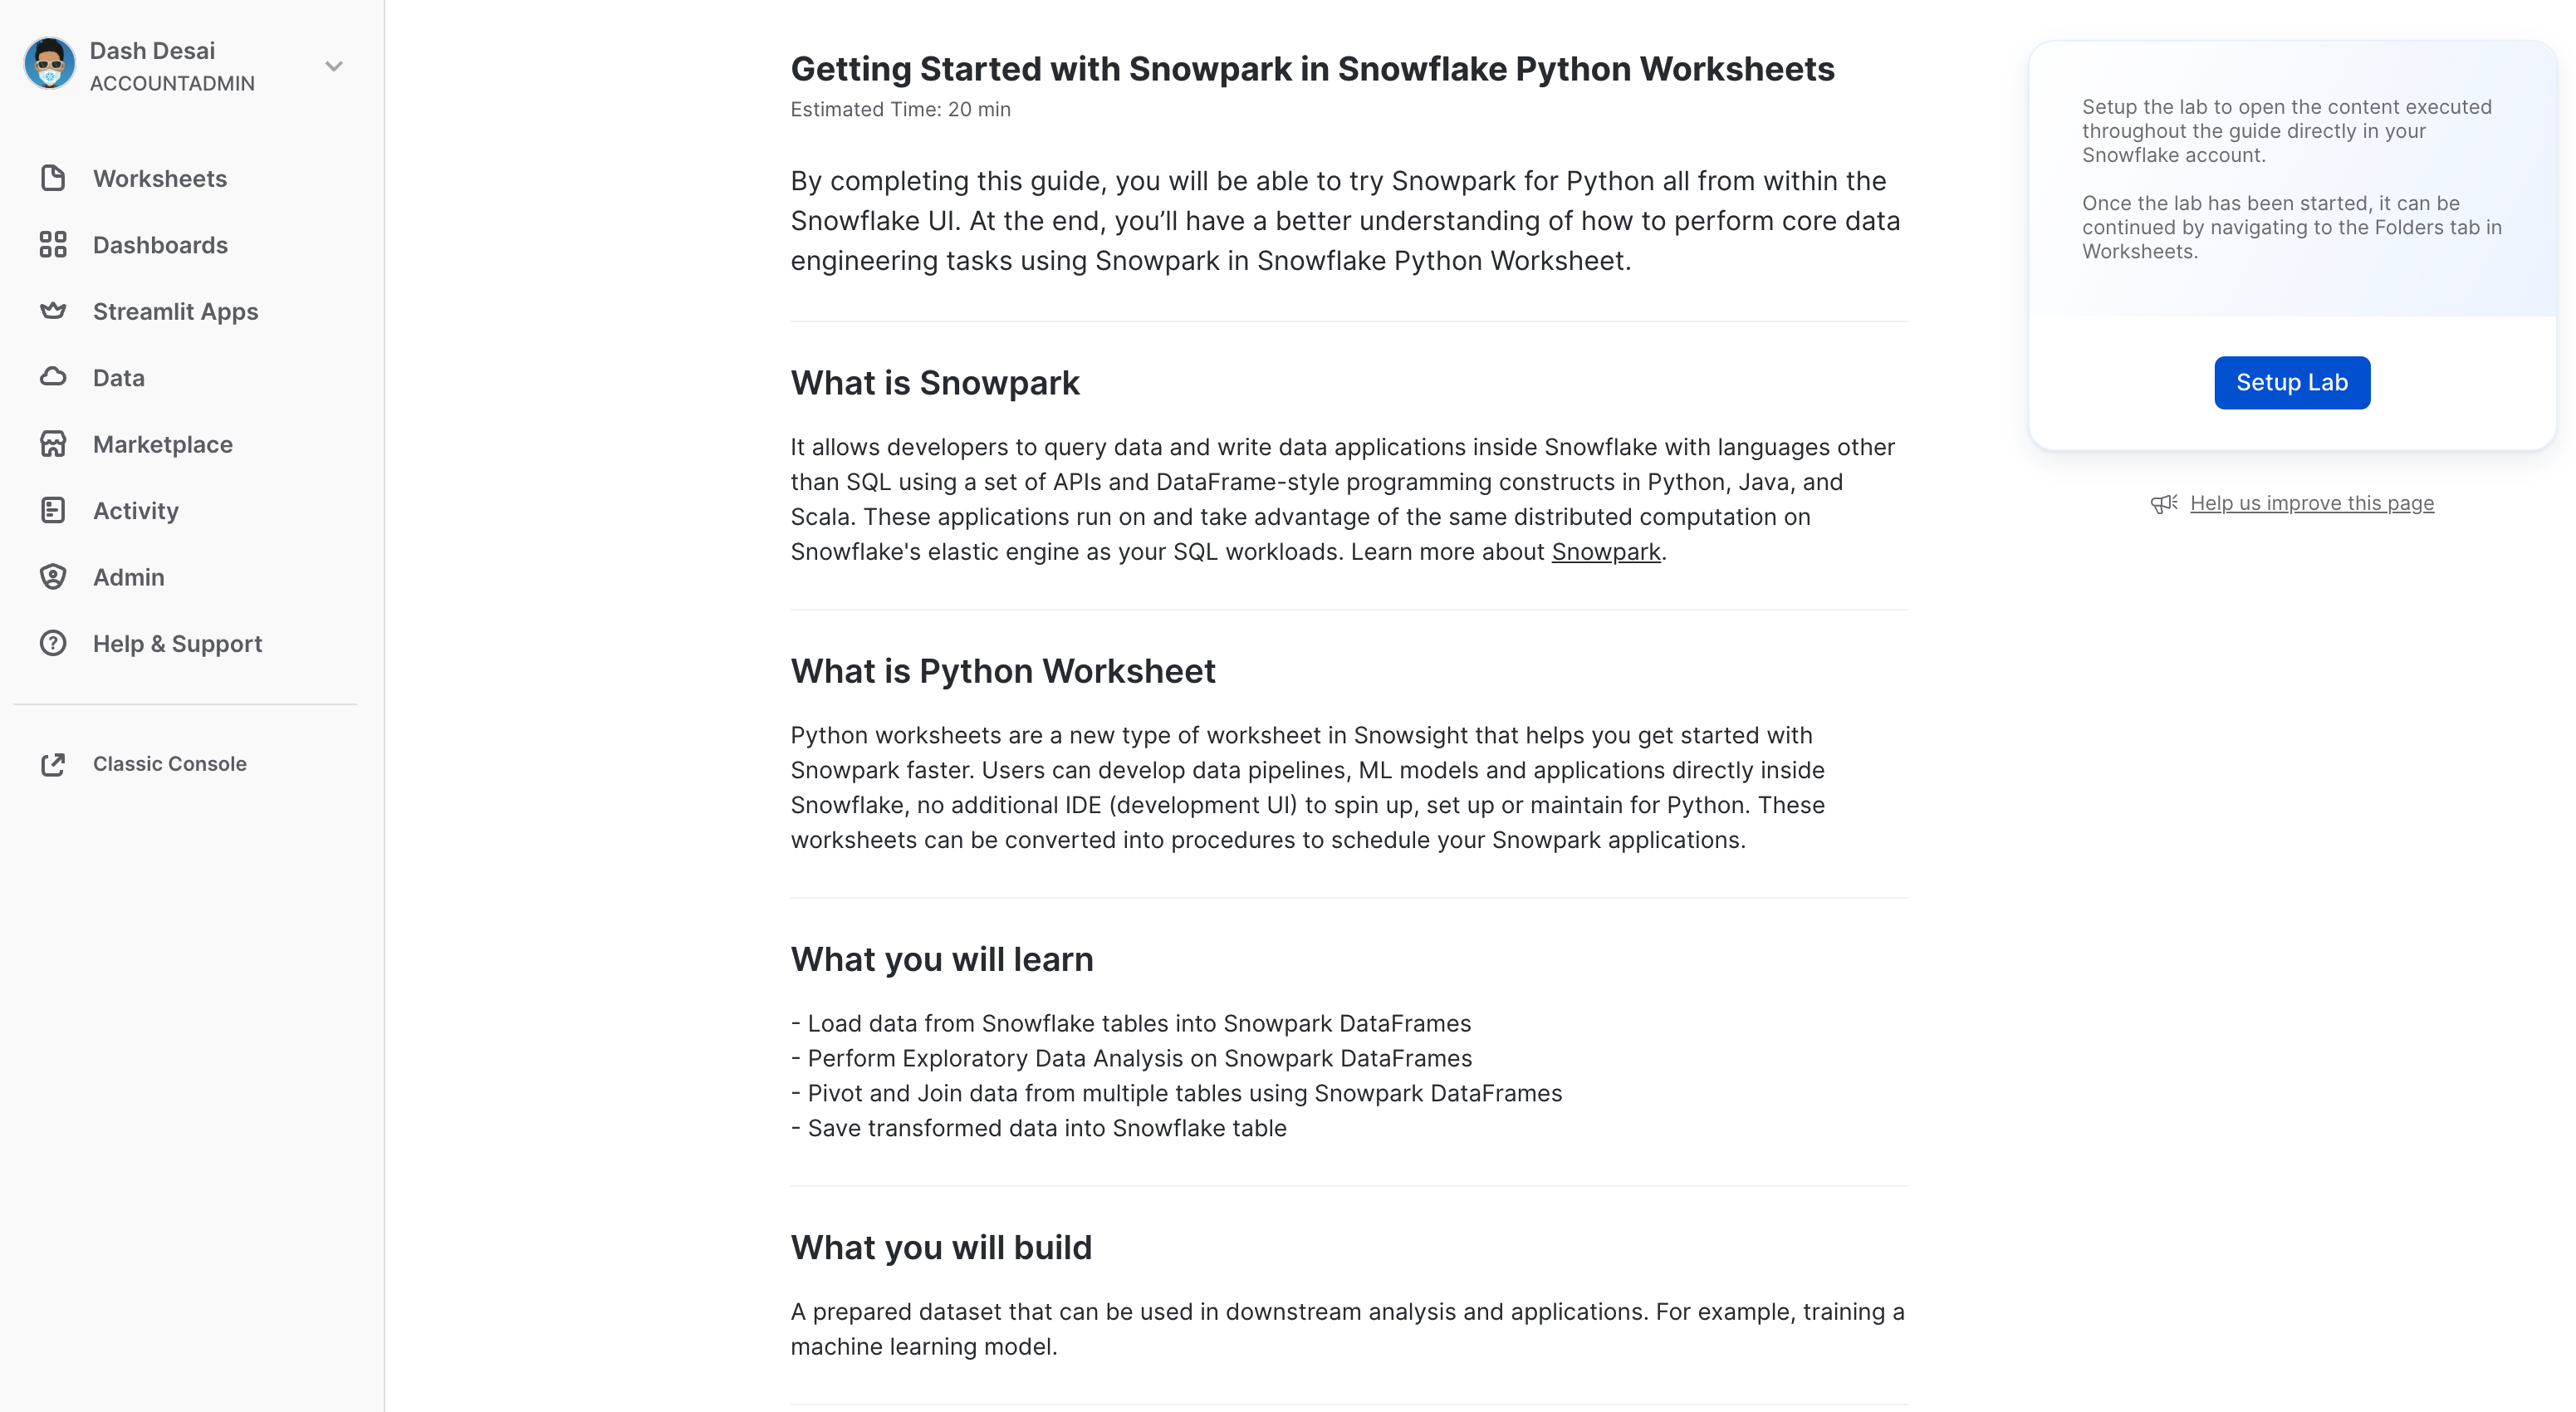
What are Python Worksheets?
Python worksheets are a new type of worksheet in Snowsight that helps you get started with Snowpark faster. Users can develop data pipelines, ML models and applications directly inside Snowflake, no additional IDE (development UI) to spin up, set up or maintain for Python. These worksheets can also be converted into procedures to schedule your Snowpark applications.
What You'll Learn
- How to load data from Snowflake tables into Snowpark DataFrames
- How to perform Exploratory Data Analysis on Snowpark DataFrames
- How to pivot and join data from multiple tables using Snowpark DataFrames
- How to save transformed data into Snowflake table
- How to deploy Python Worksheet as a Stored Procedure
What You'll Build
A prepared dataset that can be used in downstream analysis and applications. For example, training a machine learning model.
Create a Snowflake Trial Account
Sign up for a free, 30-day trial by following this link (which will land you back into the trial setup page titled Getting Started with Snowpark in Snowflake Python Worksheets). We recommend the region closest to you. We recommend the most popular edition, Enterprise, but any edition will work for this lab.
Login and Setup Lab
Log into your Snowflake account. To access this lab and set up sample data and code, you'll want to ensure you click on the following link.
The button above will take you to a page in the trial titled Getting Started with Snowpark in Snowflake Python Worksheets that will invite you to click Setup Lab which will take less than a minute and provide a setup with data and sample Python code with explanation.
==================================================================================================
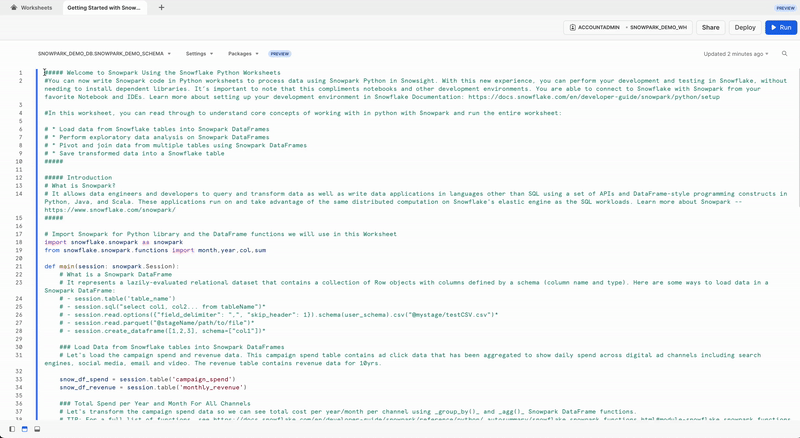
First, let's import the Snowpark Python library.
# Import Snowpark for Python
import snowflake.snowpark as snowpark
Load Aggregated Campaign Spend and Revenue Data
The campaign spend table contains ad click data that has been aggregated to show daily spend across digital ad channels including search engines, social media, email and video. The revenue table contains revenue data for 10yrs.
In this example, we will use the following code to load data from campaign_spend and monthly_revenue tables.
snow_df_spend = session.table('campaign_spend')
snow_df_revenue = session.table('monthly_revenue')
And here are some of the other ways to load data into Snowpark DataFrames.
- session.sql("select col1, col2... from tableName")
- session.read.options({"field_delimiter": ",", "skip_header": 1}).schema(user_schema).csv("@mystage/testCSV.csv")
- session.read.parquet("@stageName/path/to/file")
- session.create_dataframe([1,2,3], schema=["col1"])
TIP: Learn more about Snowpark DataFrames.
In this section, we will perform a set of transformations including aggregations and joining two dataframes.
First, let's import all the functions we will need.
from snowflake.snowpark.functions import month,year,col,sum
Total Spend per Year and Month For All Channels
Let's transform the data so we can see total cost per year/month per channel using group_by() and agg() Snowpark DataFrame functions.
snow_df_spend_per_channel = snow_df_spend.group_by(year('DATE'), month('DATE'),'CHANNEL').agg(sum('TOTAL_COST').as_('TOTAL_COST')).with_column_renamed('"YEAR(DATE)"',"YEAR").with_column_renamed('"MONTH(DATE)"',"MONTH").sort('YEAR','MONTH')
TIP: See full list of functions.
In order to view the result of this transformation, we can use the Snowpark DataFrame's show() function which will print the output under the Output tab.
print("Total Spend per Year and Month For All Channels")
snow_df_spend_per_channel.show()
Total Spend Across All Channels
Let's further transform the campaign spend data so that each row will represent total cost across all channels per year/month using pivot() and sum() Snowpark DataFrame functions.
This transformation will enable us to join with the revenue table such that we will have our input features and target variable in a single table for model training.
snow_df_spend_per_month = snow_df_spend_per_channel.pivot('CHANNEL',['search_engine','social_media','video','email']).sum('TOTAL_COST').sort('YEAR','MONTH')
snow_df_spend_per_month = snow_df_spend_per_month.select(
    col("YEAR"),
    col("MONTH"),
    col("'search_engine'").as_("SEARCH_ENGINE"),
    col("'social_media'").as_("SOCIAL_MEDIA"),
    col("'video'").as_("VIDEO"),
    col("'email'").as_("EMAIL")
)
In order to view the result of this transformation, we can use the Snowpark DataFrame's show() function which will print the output under the Output tab.
print("Total Spend Across All Channels")
snow_df_spend_per_month.show()
Total Revenue per Year and Month Data
Now let's transform the revenue data into revenue per year/month using group_by() and agg() functions.
snow_df_revenue_per_month = snow_df_revenue.group_by('YEAR','MONTH').agg(sum('REVENUE')).sort('YEAR','MONTH').with_column_renamed('SUM(REVENUE)','REVENUE')
In order to view the result of this transformation, we can use the Snowpark DataFrame's show() function which will print the output under the Output tab.
print("Total Revenue per Year and Month")
snow_df_revenue_per_month.show()
Join Total Spend and Total Revenue per Year and Month Across All Channels
Next let's join this revenue data with the transformed campaign spend data so that our input features (i.e. cost per channel) and target variable (i.e. revenue) can be loaded into a single table for further analysis and model training.
snow_df_spend_and_revenue_per_month = snow_df_spend_per_month.join(snow_df_revenue_per_month, ["YEAR","MONTH"])
In order to view the result of this transformation, we can use the Snowpark DataFrame's show() function which will print the output under the Output tab.
print("Total Spend and Revenue per Year and Month Across All Channels")
snow_df_spend_and_revenue_per_month.show()
Examine Query Explain Plan
Snowpark makes it really convenient to look at the DataFrame query and execution plan using explain() Snowpark DataFrame function.
snow_df_spend_and_revenue_per_month.explain()
The output of the above statement can be viewed in the Output tab.
Output Tab
Here's what the Output tab looks like after running the worksheet.
Let's save the transformed data into a Snowflake table SPEND_AND_REVENUE_PER_MONTH so it can be used for further analysis and/or for training a model.
snow_df_spend_and_revenue_per_month.write.mode('overwrite').save_as_table('SPEND_AND_REVENUE_PER_MONTH')
One of the return values of a Python Worksheet is of Table() type and setting that in our case will enable you to view and return the tranformed data as a Snowpark DataFrame.
return snow_df_spend_and_revenue_per_month
The output of the above statement can be viewed in the Results tab as shown below.
Results Tab
Here's what the Results tab looks like after running the worksheet.
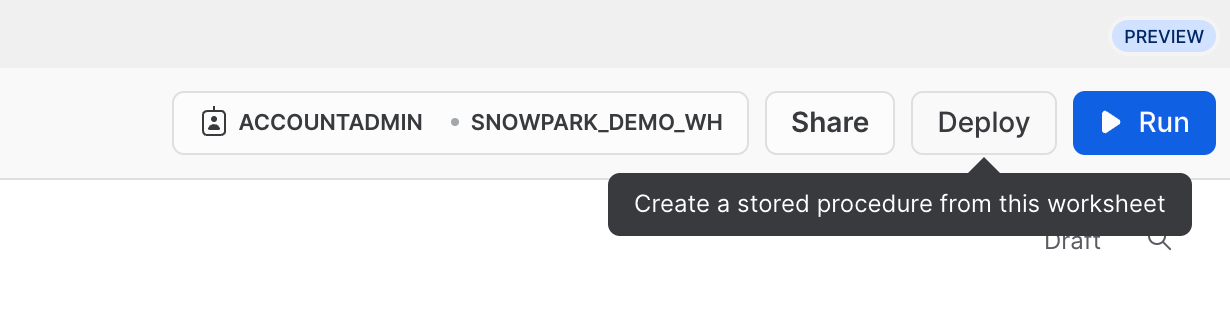
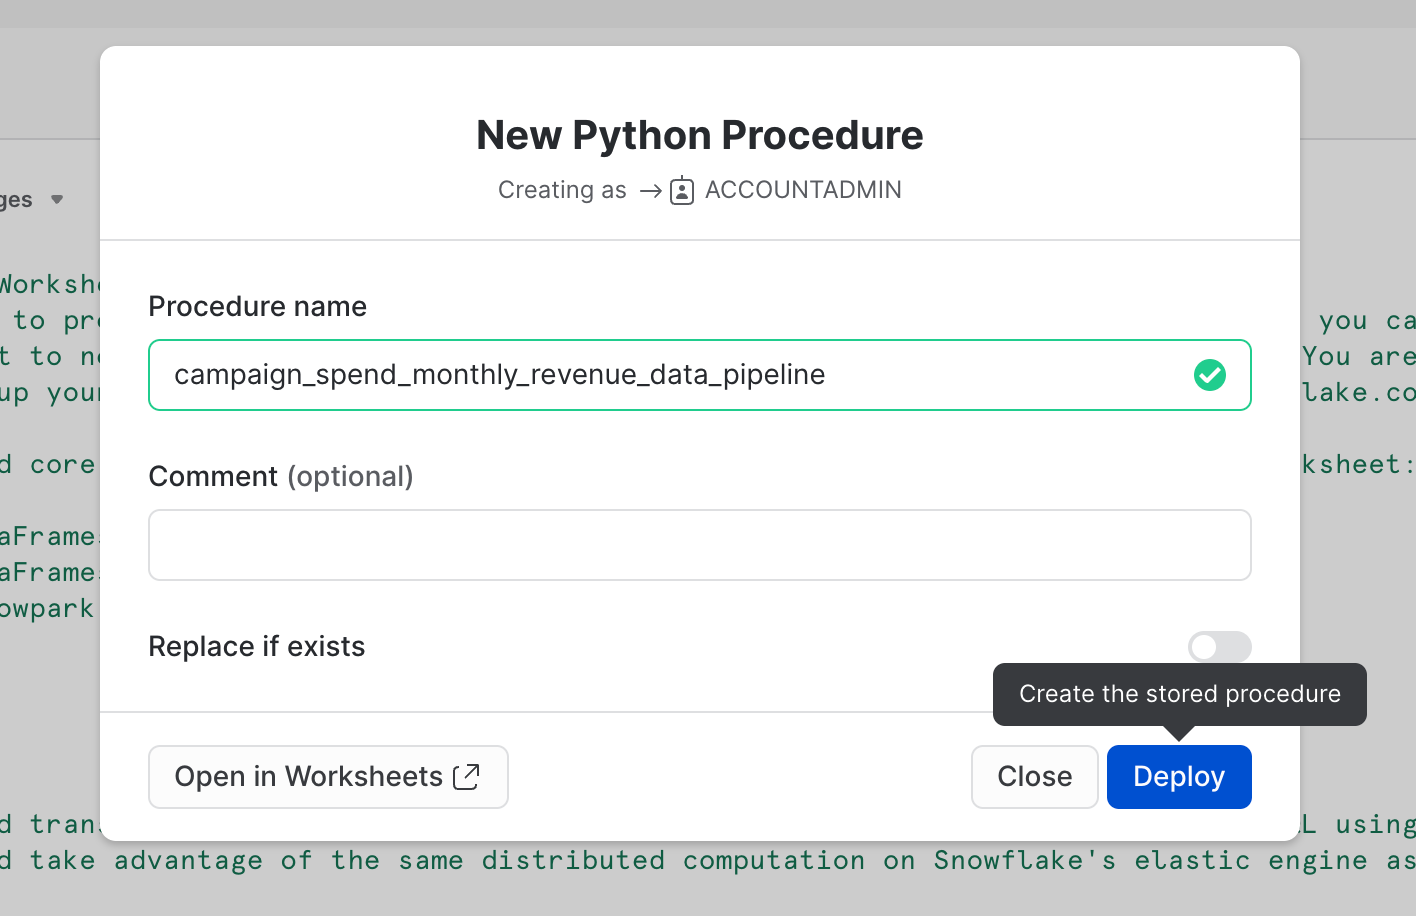
Optionally you can also deploy this worksheet as a Python Stored Procedure so that you can schedule it using Snowflake Tasks, for example. To deploy this worksheet, click on the Deploy button on the top right and follow the instructions as shown below.
==================================================================================================
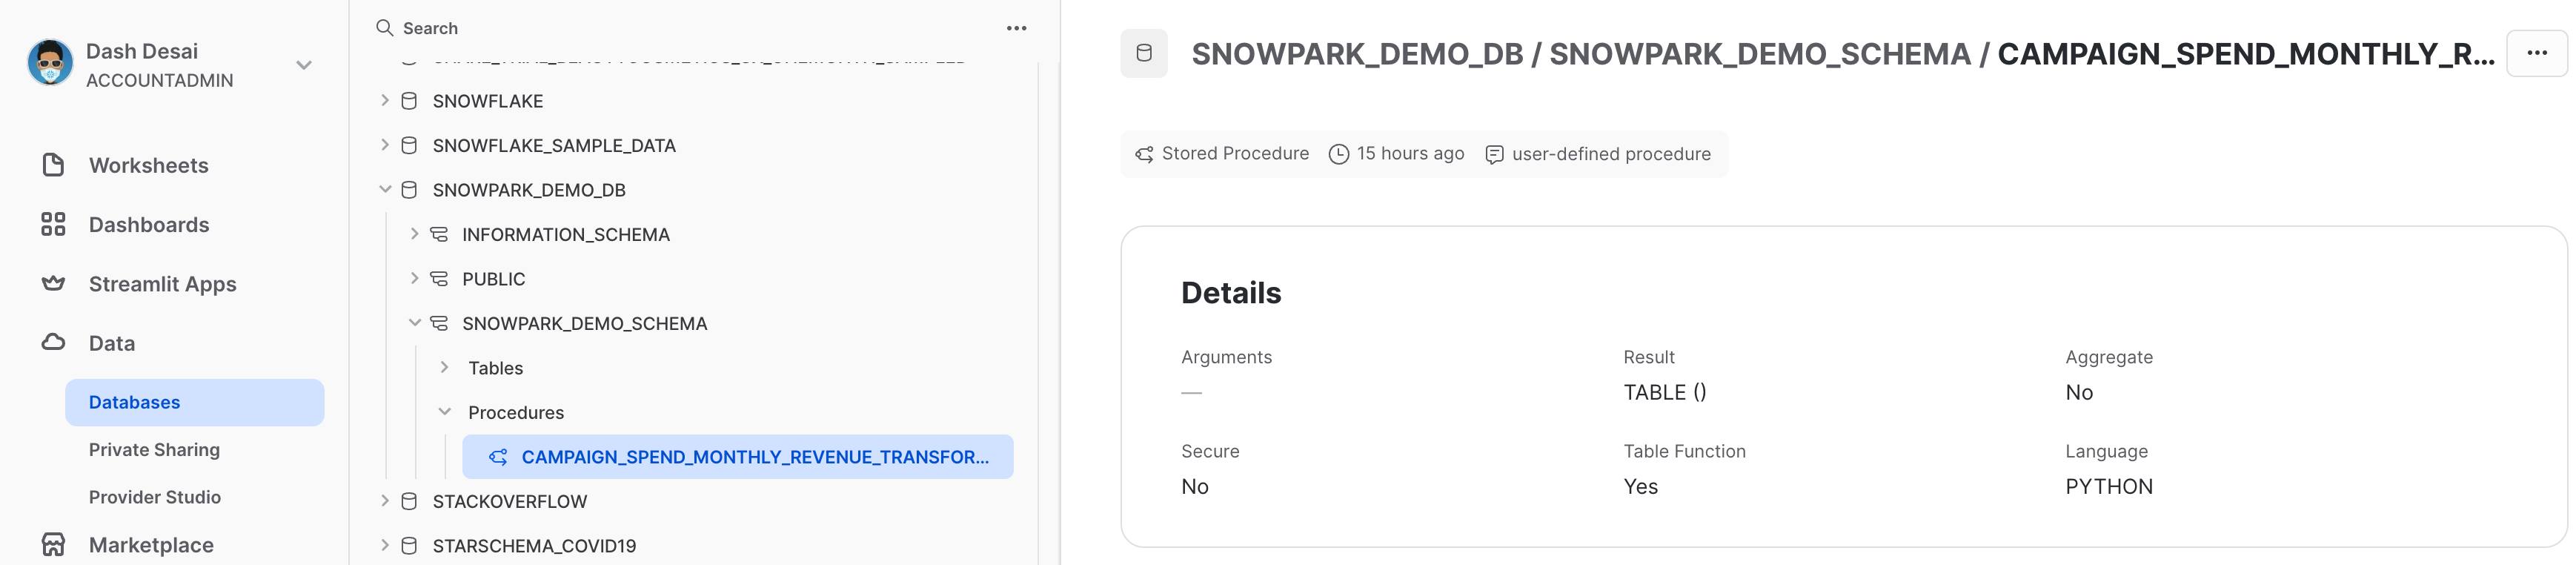
View Stored Procedure
Once it's deployed, the stored procedure details can be viewed under Data » Databases » SNOWPARK_DEMO_SCHEMA » Procedures.
Congratulations! You've successfully performed data engineering tasks using Snowpark in Snowflake Python Worksheets.
We would love your feedback on this QuickStart Guide! Please submit your feedback using this Feedback Form.
What You Learned
- How to load data from Snowflake tables into Snowpark DataFrames
- How to perform Exploratory Data Analysis on Snowpark DataFrames
- How to pivot and join data from multiple tables using Snowpark DataFrames
- How to save transformed data into Snowflake table
- How to deploy Python Worksheet as a Stored Procedure
Next Steps
To learn how to process data incrementally, orchestrate data pipelines with Snowflake tasks, deploy them via a CI/CD pipeline and how to use Snowflake's new developer CLI tool as well as Visual Studio Code extension, continue your journey and deep dive into Data Engineering Pipelines with Snowpark Python.