This quickstart demonstrates how to build a real-time Change Data Capture (CDC) pipeline from PostgreSQL to Snowflake using Openflow. You'll learn how to capture both initial snapshots and incremental changes, enabling real-time analytics on transactional data.
We use a healthcare appointment management system as our demo dataset, but the same patterns apply to any database-based application including e-commerce, CRM, ERP, and other transactional systems.
Healthcare Appointments Demo Dataset
You'll work with a realistic Healthcare Appointment Management system that includes:
- 100 synthetic patients with diverse demographics
- 10 doctors across 5 medical specializations
- 170 appointments (150 historical + 20 upcoming)
- 120 visit records with diagnoses and charges
- Real-time CDC events demonstrating INSERT, UPDATE operations
By completing this guide, you will build an end-to-end CDC pipeline that captures changes from PostgreSQL in real-time and enables analytics in Snowflake.
Here is a summary of what you will learn in each step by following this quickstart:
- Setup Environment: Configure Snowflake database objects, PostgreSQL instance, and network access
- Openflow Configuration: Set up Openflow SPCS runtime
- Add PostgreSQL Connector: Configure the PostgreSQL CDC connector
- Initialize PostgreSQL Database: Load healthcare schema and synthetic data
- Verify Snapshot Load: Confirm initial data capture in Snowflake
- Generate Live CDC Events: Simulate real-time appointment operations
- Real-time Analytics: Query live data and analyze CDC metadata
- Monitor CDC Pipeline: Track replication lag and data quality
What is Openflow
Snowflake Openflow is an integration service that connects any data source and any destination with hundreds of processors supporting structured and unstructured text, images, audio, video and sensor data. Built on Apache NiFi, Openflow lets you run a fully managed service in your own cloud for complete control.
Key Features and Benefits:
- Open and Extensible: An extensible managed service powered by Apache NiFi, enabling you to build and extend processors from any data source to any destination
- Unified Data Integration Platform: Handle complex, bi-directional data extraction and loading through a fully managed service
- Enterprise-Ready: Out-of-the-box security, compliance, and observability hooks for data integration
- High Speed Ingestion: Handle structured and unstructured data in both batch and streaming modes at virtually any scale
- Continuous Multimodal Data: Near real-time unstructured data ingestion from sources like SharePoint, Google Drive, and more
Openflow Deployment Models:
Openflow is available in two deployment options, both supporting the same connectors and features:
- Snowflake Deployment (SPCS): Streamlined and integrated solution using Snowpark Container Services. Native integration with Snowflake's security model for seamless authentication, authorization, and network security. This quickstart uses SPCS deployment.
- Bring Your Own Cloud (BYOC): Data processing engine runs within your own cloud environment (AWS, Azure, GCP) while Snowflake manages the overall service and control plane. Ideal for handling sensitive data preprocessing locally within your organization's cloud environment.
Learn more at the Openflow documentation and BYOC deployments.
What is Change Data Capture (CDC)
Change Data Capture (CDC) is a design pattern that identifies and captures changes made to data in a database, then delivers those changes in real-time to a downstream system. Instead of periodically querying the entire database, CDC efficiently tracks only what changed.
How PostgreSQL CDC Works:
PostgreSQL CDC uses logical replication, which reads changes from the Write-Ahead Log (WAL). When data is modified in PostgreSQL:
- Changes are written to the WAL (a transaction log)
- A replication slot captures these changes
- A publication defines which tables to track
- Openflow reads from the replication slot and delivers changes to Snowflake
CDC Benefits:
- Changes flow to Snowflake within seconds
- Complete history of all INSERT, UPDATE, DELETE operations
- Built-in audit trail with CDC metadata
- Minimal overhead on source database
- Only changes are transferred after initial snapshot
CDC vs Traditional Batch ETL:
Aspect | CDC | Batch ETL |
Latency | Seconds | Hours/Days |
Data Freshness | Real-time | Scheduled intervals |
Network Impact | Changes only | Full table scans |
Database Load | Minimal (log reading) | High (full queries) |
History | All changes tracked | Point-in-time snapshots |
Learn more about PostgreSQL CDC with Openflow.
What You Will Learn
You'll configure PostgreSQL logical replication, set up the Openflow CDC connector, and capture both snapshot and incremental changes. Then you'll use Snowflake Intelligence to query your CDC data with natural language.
What You Will Build
A real-time healthcare appointment tracking system with an automated CDC pipeline from PostgreSQL to Snowflake, complete with audit trails for all data changes.
Prerequisites
Before starting, ensure you have:
- Snowflake Account: Enterprise account with Openflow SPCS deployment enabled (AWS or Azure regions)
- Account Permissions: ACCOUNTADMIN role or equivalent for initial setup
- PostgreSQL Instance: PostgreSQL 11+ with logical replication enabled (AWS RDS, Amazon Aurora, GCP Cloud SQL, Azure Database, or self-hosted)
- Network Connectivity: Ability to configure network access from Snowflake to PostgreSQL
git clone https://github.com/Snowflake-Labs/sfguide-getting-started-openflow-postgresql-cdc.git
cd sfguide-getting-started-openflow-postgresql-cdc
Repository Contents:
sql/0.init_healthcare.sql- PostgreSQL schema and synthetic data initializationsql/1.snowflake_setup.sql- Snowflake environment setup (role, database, warehouse, network rules)sql/2.verify_snapshot.sql- Snapshot load verification queriessql/3.live_appointments.sql- Live CDC event generation scriptsql/4.analytics_queries.sql- Real-time analytics query examples
In this section, we'll configure PostgreSQL for CDC and load the healthcare demo data.
PostgreSQL Requirements
This guide assumes you have a PostgreSQL instance already created and available. Before proceeding, ensure your instance meets these requirements:
Enable Logical Replication (If Not Already Enabled)
PostgreSQL CDC requires logical replication to be enabled. This allows the connector to capture changes from the Write-Ahead Log (WAL).
Grant REPLICATION privileges to your PostgreSQL user:
ALTER USER postgres WITH REPLICATION;
Enable logical replication via your PostgreSQL service:
- GCP Cloud SQL: Set the
cloudsql.logical_decodingandcloudsql.enable_pglogicalflags toon - AWS RDS or AWS Aurora: Set
rds.logical_replication = 1and apply it to your instance - Azure Database: Set
wal_level = logicalvia the Azure portal or Azure CLI - Self-hosted PostgreSQL: Edit
postgresql.confto setwal_level = logical(or runALTER SYSTEM SET wal_level = logical;), then restart PostgreSQL
After enabling logical replication and restarting your PostgreSQL instance if needed, you'll verify the wal_level setting in the next section after setting up your PostgreSQL client.
Setup Notes
Before configuring your PostgreSQL environment, note these setup considerations:
- Service Compatibility: You can use any PostgreSQL service:
- GCP Cloud SQL
- AWS RDS
- Amazon Aurora
- Azure Database for PostgreSQL
- Self-hosted PostgreSQL
- Client Tools: You can use any PostgreSQL client you're comfortable with -
psqlcommand-line tool, pgAdmin, DBeaver, DataGrip, TablePlus, or others. This guide showspsqlexamples, but the SQL scripts work with any client. - PostgreSQL User: This guide uses the
postgresuser for both CLI connections and Openflow connector configuration. You can use any PostgreSQL user with appropriate privileges (superuser or replication role) - just ensure the user has permissions for logical replication and can create publications and replication slots.
Setup PostgreSQL Client Environment
This section shows how to install and configure the psql command-line tool, which is used throughout this guide.
Set Environment Variables
Set these environment variables to avoid repeating connection parameters:
export PGHOST='YOUR-POSTGRES-HOST'        # e.g., '34.123.45.67' for GCP Cloud SQL
export PGPORT='5432'
export PGDATABASE='postgres'
export PGUSER='postgres'
These variables will be referenced throughout the guide (e.g., $PGHOST, $PGUSER) for convenience.
Configure Password File
Create a .pgpass file to avoid entering your password repeatedly. This file securely stores your PostgreSQL credentials.
# Create .pgpass file (Unix/Linux/macOS)
echo "$PGHOST:$PGPORT:$PGDATABASE:$PGUSER:YOUR-PASSWORD" >> ~/.pgpass

# Set proper permissions (required for security)
chmod 0600 ~/.pgpass
Test PostgreSQL Connection
Before proceeding with any configuration, verify that your PostgreSQL instance is accessible and that logical replication is enabled.
Check PostgreSQL Accessibility
First, ensure your PostgreSQL instance allows external connections:
For GCP Cloud SQL:
- Navigate to Cloud SQL instance → Connections → Networking
- Ensure Public IP is enabled (or VPC peering is configured for private)
- Add authorized networks if needed (or configure for broad access during demo)
- Note the Public IP Address - you'll need this for both client connection and Snowflake network rule
For AWS RDS:
- Navigate to RDS instance → Connectivity & security
- Ensure Publicly accessible is "Yes" (or VPC peering is configured)
- Check Security group allows inbound traffic on port 5432
- Note the Endpoint - you'll need this for both client connection and Snowflake network rule
For Azure Database for PostgreSQL:
- Navigate to PostgreSQL server → Connection security
- Ensure Allow access to Azure services is enabled
- Add firewall rules for your IP address
- Note the Server name - you'll need this for both client connection and Snowflake network rule
For self-hosted PostgreSQL:
- Ensure
pg_hba.confallows connections from your IP (or use0.0.0.0/0for demo) - Firewall allows inbound traffic on port 5432
- PostgreSQL is listening on external interfaces (
listen_addresses = '*'inpostgresql.conf)
Test Basic Connection
Test the connection to your PostgreSQL instance using any method you prefer:
Option 1: Using psql:
If you set up environment variables and .pgpass in the previous section, simply run:
psql -c "SELECT version();"
If you didn't set up environment variables, specify connection parameters explicitly:
psql -h YOUR-POSTGRES-HOST -p 5432 -U postgres -d postgres -c "SELECT version();"
Option 2: Using pgAdmin, DBeaver, or other GUI client:
- Create a new connection with your PostgreSQL host, port, username, and password
- Test the connection
- Run
SELECT version();to verify
Expected result (version number may vary):
                                                 version
----------------------------------------------------------------------------------------------------------
 PostgreSQL 17.2 on x86_64-pc-linux-gnu, compiled by gcc (Debian 12.2.0-14) 12.2.0, 64-bit
(1 row)
Verify psql Configuration (Optional)
If you set up environment variables and .pgpass, test that they're working correctly:
psql -c "SELECT current_database(), current_user;"
Expected output:
 current_database | current_user
------------------+--------------
 postgres         | postgres
(1 row)
If the connection succeeds without prompting for a password, your psql environment is configured correctly.
Verify Logical Replication
Confirm that logical replication is enabled (as required in the PostgreSQL Requirements section):
psql -c "SHOW wal_level;"
Expected output:
 wal_level
-----------
 logical
(1 row)
If the output shows logical, you're all set! If not, go back to the "Enable Logical Replication" section in PostgreSQL Requirements and ensure you've enabled wal_level = logical and restarted your PostgreSQL instance.
Initialize Healthcare Database
Now we'll initialize the PostgreSQL database with the healthcare schema, synthetic data, and CDC configuration.
Execute the Initialization Script
The sql/0.init_healthcare.sql script will:
- Grant replication privileges to the postgres user
- Create the
healthcareschema - Create tables:
patients,doctors,appointments,visits - Load 100 synthetic patients, 10 doctors, 170 appointments, and 100 visit records
- Create indexes for performance
- Configure CDC publication for logical replication
Run the Script
psql -f sql/0.init_healthcare.sql
Verify PostgreSQL Setup
Before connecting Openflow, let's verify the entire PostgreSQL CDC configuration is correct.
Check Tables Exist
psql -c "\dt healthcare.*"
Expected output:
              List of relations
   Schema   |     Name     | Type  |  Owner
------------+--------------+-------+----------
 healthcare | appointments | table | postgres
 healthcare | doctors      | table | postgres
 healthcare | patients     | table | postgres
 healthcare | visits       | table | postgres
(4 rows)
Check Row Counts
psql -c "SELECT
  (SELECT COUNT(*) FROM healthcare.patients) as patients,
  (SELECT COUNT(*) FROM healthcare.doctors) as doctors,
  (SELECT COUNT(*) FROM healthcare.appointments) as appointments,
  (SELECT COUNT(*) FROM healthcare.visits) as visits;"
Expected output:
 patients | doctors | appointments | visits
----------+---------+--------------+--------
      100 |      10 |          170 |    100
(1 row)
Verify CDC Publication
psql -c "SELECT * FROM pg_publication WHERE pubname = 'healthcare_cdc_publication';"
Expected output:
          pubname           | pubowner | puballtables | pubinsert | pubupdate | pubdelete | pubtruncate
----------------------------+----------+--------------+-----------+-----------+-----------+-------------
 healthcare_cdc_publication |    16390 | t            | t         | t         | t         | t
(1 row)
Verify Published Tables
psql -c "SELECT schemaname, tablename FROM pg_publication_tables WHERE pubname = 'healthcare_cdc_publication';"
Expected output:
 schemaname |  tablename
------------+--------------
 healthcare | appointments
 healthcare | doctors
 healthcare | patients
 healthcare | visits
(4 rows)
Check CDC Configuration
psql -c "SELECT
    current_setting('wal_level') AS wal_level,
    current_setting('max_replication_slots') AS max_replication_slots,
    current_setting('max_wal_senders') AS max_wal_senders,
    (SELECT count(*) FROM pg_publication) AS publication_count,
    (SELECT count(*) FROM pg_replication_slots) AS active_slots;"
Expected output:
 wal_level | max_replication_slots | max_wal_senders | publication_count | active_slots
-----------+-----------------------+-----------------+-------------------+--------------
 logical   | 10                    | 10              | 1                 | 0
(1 row)
Verify Replication Privileges
psql -c "SELECT rolname, rolsuper, rolreplication FROM pg_roles WHERE rolname = '$PGUSER';"
Expected output:
 rolname  | rolsuper | rolreplication
----------+----------+----------------
 postgres | f        | t
(1 row)
The rolreplication column should be t (true). If it's f (false), grant replication privileges:
psql -c "ALTER USER $PGUSER WITH REPLICATION;"
Next, let us setup the Snowflake environment.
In this section, we'll set up the Snowflake objects needed for the CDC pipeline.
Create Snowflake Objects
Now we'll set up all required Snowflake objects for the CDC pipeline. This includes creating a dedicated role, database, warehouse, and network access configuration.
What We're Creating
- Role:
QUICKSTART_ROLE- Dedicated role for Openflow runtime - Database:
QUICKSTART_PGCDC_DB- Database for healthcare CDC data - Warehouse:
QUICKSTART_PGCDC_WH- Compute warehouse for data processing - Network Rule: PostgreSQL connection endpoint
- External Access Integration: Allows SPCS to connect to PostgreSQL
- Snowflake Intelligence Infrastructure:
snowflake_intelligencedatabase andagentsschema for AI-powered analytics
Execute the Setup Script
Open Workspaces in Snowsight (Projects → Workspaces), copy paste the sql/1.snowflake_setup.sql script and execute it.
The script will:
- Create the
QUICKSTART_ROLErole (or reuse if coming from SPCS quickstart) - Create
QUICKSTART_PGCDC_DBdatabase with two schemas:HEALTHCARE- For CDC data tablesNETWORKS- For network rule definitions
- Create
QUICKSTART_PGCDC_WHwarehouse (MEDIUM size, auto-suspend after 5 minutes) - Create network rule for PostgreSQL connectivity
- Create external access integration
quickstart_pgcdc_access - Create Snowflake Intelligence infrastructure (
snowflake_intelligencedatabase andagentsschema) - Grant appropriate permissions
Verify Snowflake Setup
After running the script, verify the setup in a new SQL worksheet in Snowsight.
Open a new SQL worksheet and run the following verification queries:
Verify Schemas
USE ROLE QUICKSTART_ROLE;
USE WAREHOUSE QUICKSTART_PGCDC_WH;
SHOW SCHEMAS IN DATABASE QUICKSTART_PGCDC_DB;
Expected output (note: the healthcare schema will be automatically created by Openflow when the connector is added):
| created_on          | name                  | is_default | is_current | database_name      | owner            | comment | options | retention_time | owner_role_type |
|---------------------|-----------------------|------------|------------|--------------------|--------------------|---------|---------|----------------|-----------------|
| 2025-10-07 10:00:00 | INFORMATION_SCHEMA    | N          | N          | QUICKSTART_PGCDC_DB | ACCOUNTADMIN      |         |         | 1              | ROLE            |
| 2025-10-07 10:00:00 | NETWORKS              | N          | N          | QUICKSTART_PGCDC_DB | QUICKSTART_ROLE   |         |         | 1              | ROLE            |
| 2025-10-07 10:00:00 | PUBLIC                | Y          | N          | QUICKSTART_PGCDC_DB | QUICKSTART_ROLE   |         |         | 1              | ROLE            |
Verify Integration
SHOW INTEGRATIONS LIKE 'quickstart_pgcdc_access';
Expected output:
| name                      | type              | category          | enabled | comment                                    | created_on          |
|---------------------------|-------------------|-------------------|---------|--------------------------------------------|--------------------|
| quickstart_pgcdc_access   | EXTERNAL_ACCESS   | SECURITY          | true    | OpenFlow SPCS runtime access for PostgreSQL CDC | 2025-10-07 10:00:00 |
Verify Network Rule
Verify that Snowflake's network rule is correctly configured to allow connections to your PostgreSQL instance.
Check the network rule configuration:
DESC NETWORK RULE QUICKSTART_PGCDC_DB.NETWORKS.postgres_network_rule;
Expected output should show your actual PostgreSQL host:
| name                     | type       | mode   | value_list                     | comment |
|--------------------------|------------|--------|--------------------------------|---------|
| postgres_network_rule    | HOST_PORT  | EGRESS | ['your-actual-host.com:5432']  |         |
✅ Network Rule Verification Complete!
You've verified that the Snowflake network rule matches your PostgreSQL host and port.
In this section, you'll set up the Openflow SPCS infrastructure needed to run the PostgreSQL connector. Before proceeding, ensure you've completed the Snowflake setup with QUICKSTART_ROLE, QUICKSTART_PGCDC_DB database, and QUICKSTART_PGCDC_WH warehouse.
Complete Openflow SPCS Setup
This CDC quickstart builds on the foundational Openflow SPCS setup. Navigate to the Getting Started with Openflow SPCS quickstart and complete the following two sections (approximately 15 minutes total):
- Setup Core Snowflake: Create
OPENFLOW_ADMINrole and enable BCR Bundle 2025_06. - Create Deployment: Set up your Openflow SPCS deployment (e.g.,
QUICKSTART_DEPLOYMENT).
Once your deployment is active, return here to create a runtime. If you already have an Openflow deployment, you can skip the deployment creation and just ensure you select the correct deployment name when creating the runtime.
After completing these prerequisite sections, you'll have:
OPENFLOW_ADMINrole with deployment privileges- BCR Bundle 2025_06 enabled (required for CDC connectors)
- Active Openflow deployment
- Network rules for Snowflake infrastructure
Create Runtime for PostgreSQL CDC
Now that you have an active Openflow deployment, create a runtime environment specifically configured for the PostgreSQL connector.
Resources from Setup Environment: You already created the following in the "Setup Environment" section:
QUICKSTART_ROLE- Runtime roleQUICKSTART_PGCDC_DB- Database withNETWORKSschemaQUICKSTART_PGCDC_WH- Warehousepostgres_network_rule- Network rulequickstart_pgcdc_access- External access integration
Verify External Access Integration
Verify the external access integration created in the "Setup Environment" section:
USE ROLE QUICKSTART_ROLE;

-- Verify integration exists and is enabled
SHOW INTEGRATIONS LIKE 'quickstart_pgcdc_access';
DESC INTEGRATION quickstart_pgcdc_access;
Expected output for SHOW INTEGRATIONS:
| name                     | type              | category | enabled | comment                                              | created_on          |
|--------------------------|-------------------|----------|---------|------------------------------------------------------|---------------------|
| quickstart_pgcdc_access  | EXTERNAL_ACCESS   | SECURITY | true    | OpenFlow SPCS runtime access for PostgreSQL CDC      | 2025-10-07 10:00:00 |
Create Runtime via Snowsight
Follow these steps to create your runtime:
- Navigate to Openflow: Go to Work with data → Ingestion → Openflow
- Switch to Runtimes Tab: Click the Runtimes tab
- Ensure Correct Role: Verify your role is set to
OPENFLOW_ADMIN(check top-right corner of Snowsight) - Click Create Runtime: Click the + Runtime button
- Configure Runtime:
- Name:
QUICKSTART_PGCDC_RUNTIME - Deployment: Select
QUICKSTART_DEPLOYMENT(or your deployment name) - Runtime Role: Select
QUICKSTART_ROLE - External Access Integration: Select
quickstart_pgcdc_access
- Name:
- Click Create: Complete the runtime creation
Verify Runtime Status
Check that your runtime is active:
- Navigate to Runtimes Tab: Go to Work with data → Ingestion → Openflow → Runtimes
- Check Status: Look for
QUICKSTART_PGCDC_RUNTIMEwith status ACTIVE
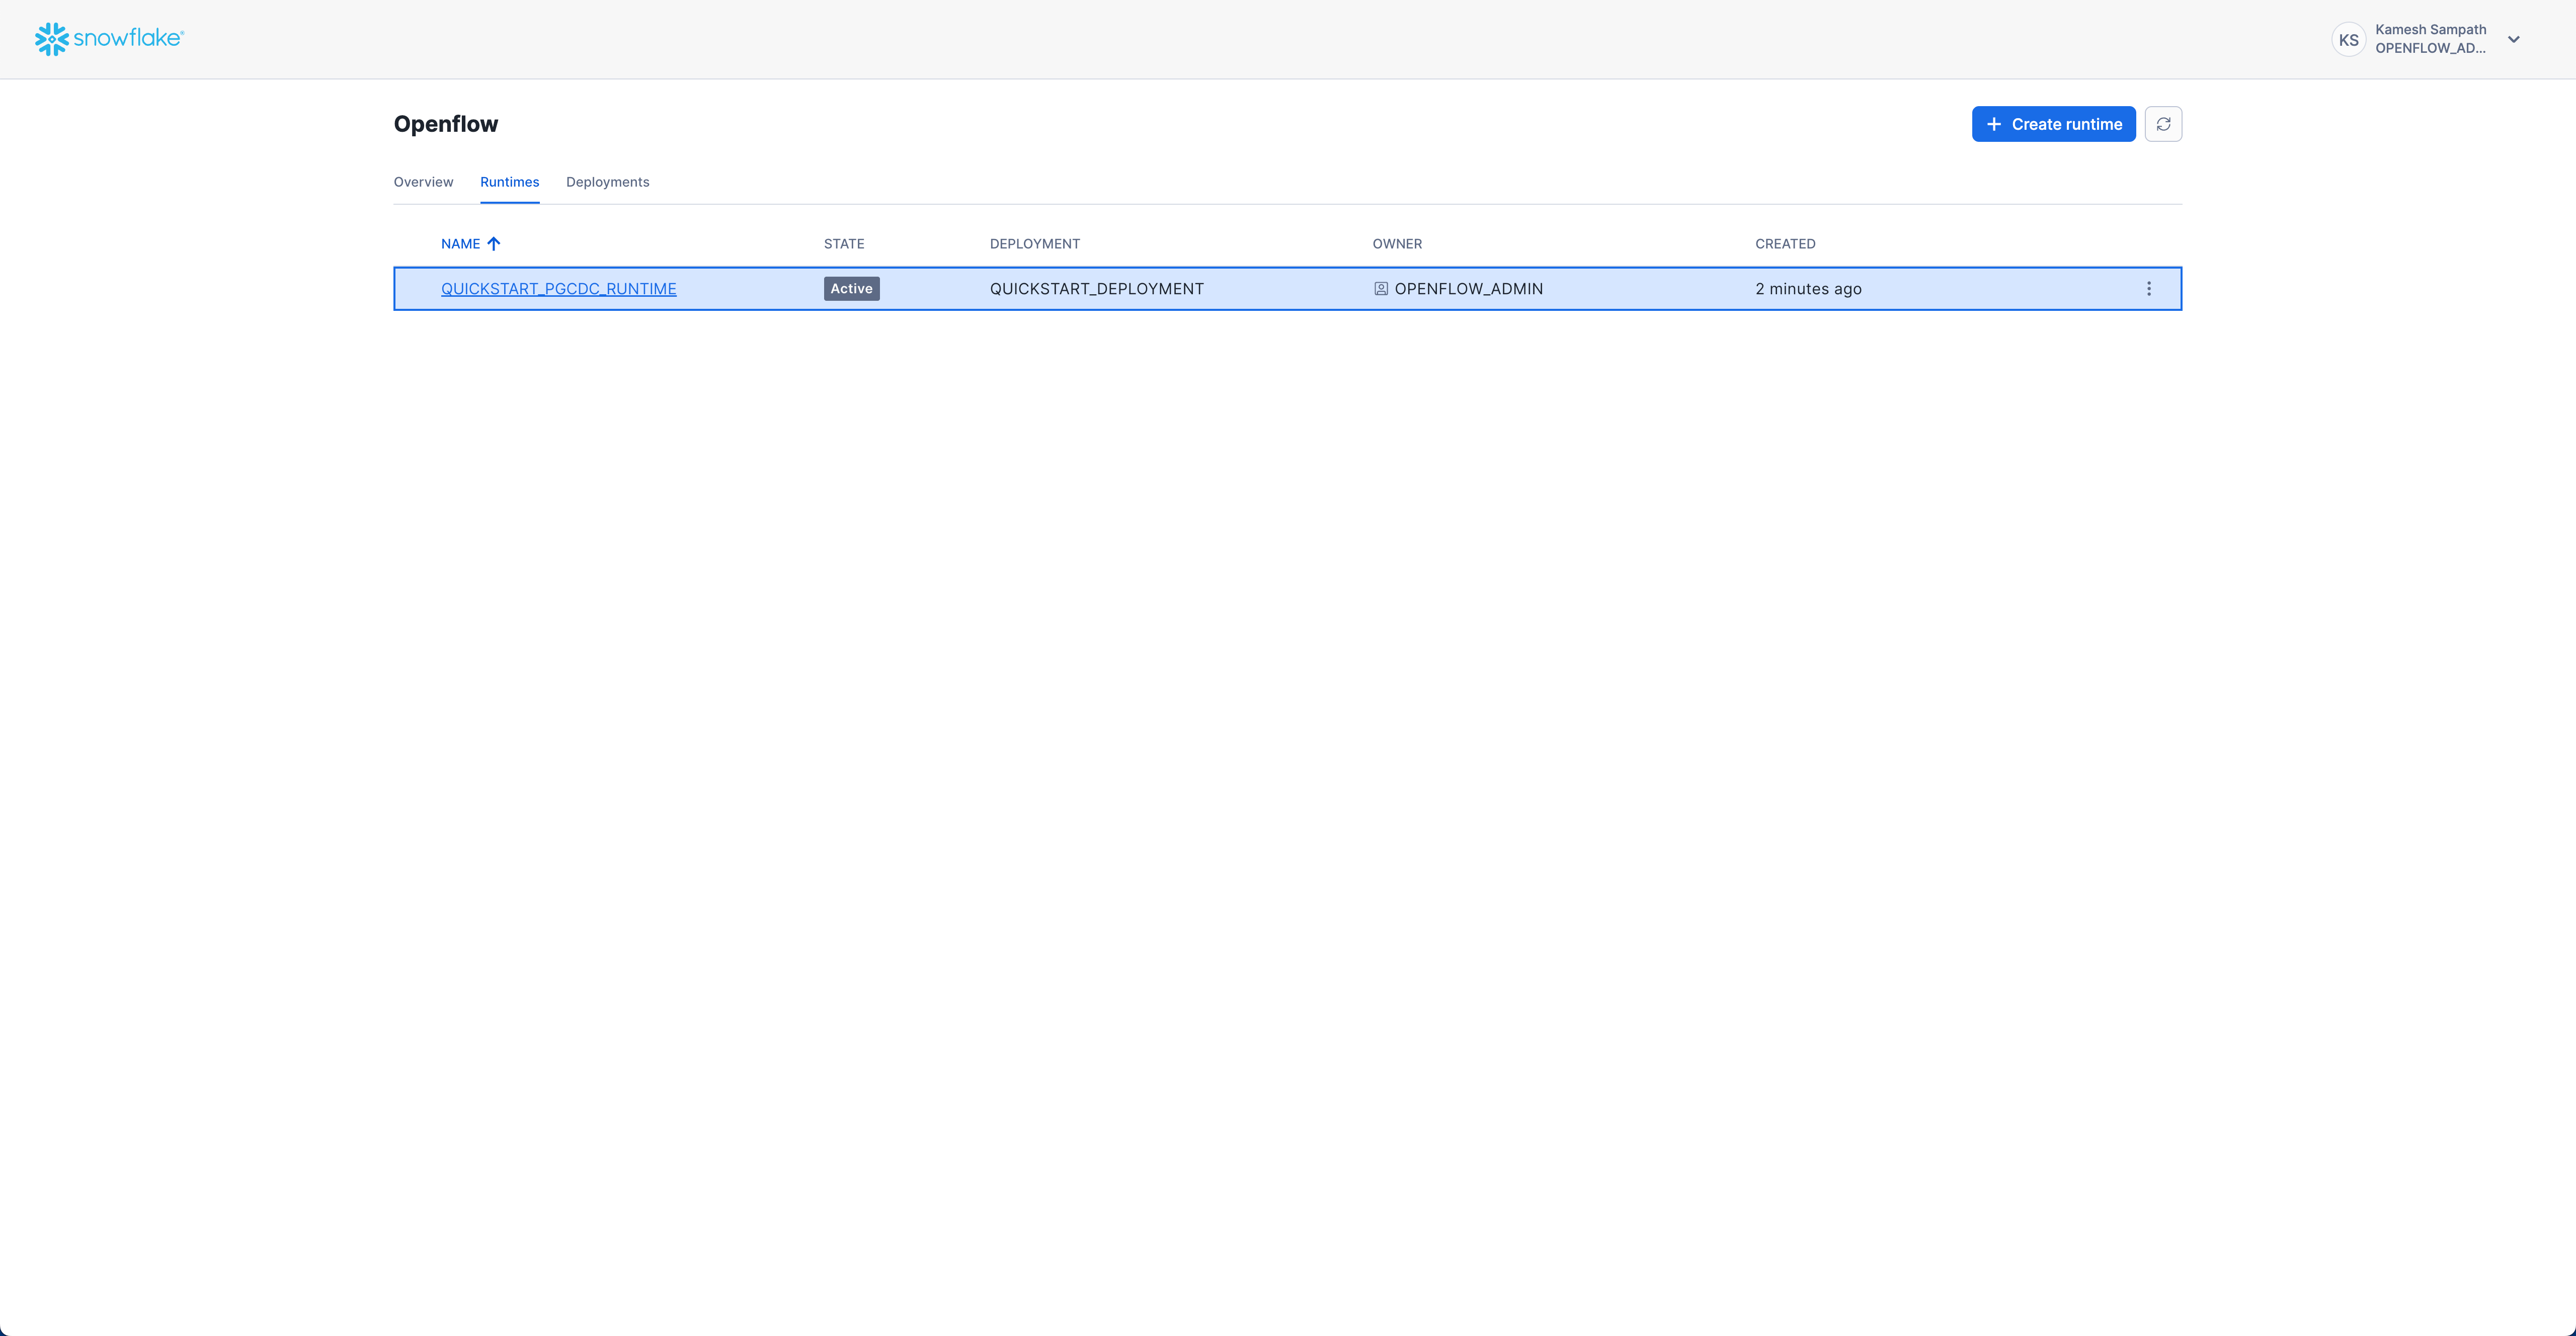
Expected status: ACTIVE
Access the Runtime Canvas
Once your runtime is active, you can access the Openflow canvas to add and configure connectors:
Click on the runtime name (QUICKSTART_PGCDC_RUNTIME) to open the canvas. This will open in a new browser tab where you'll configure connectors and build your data pipeline.
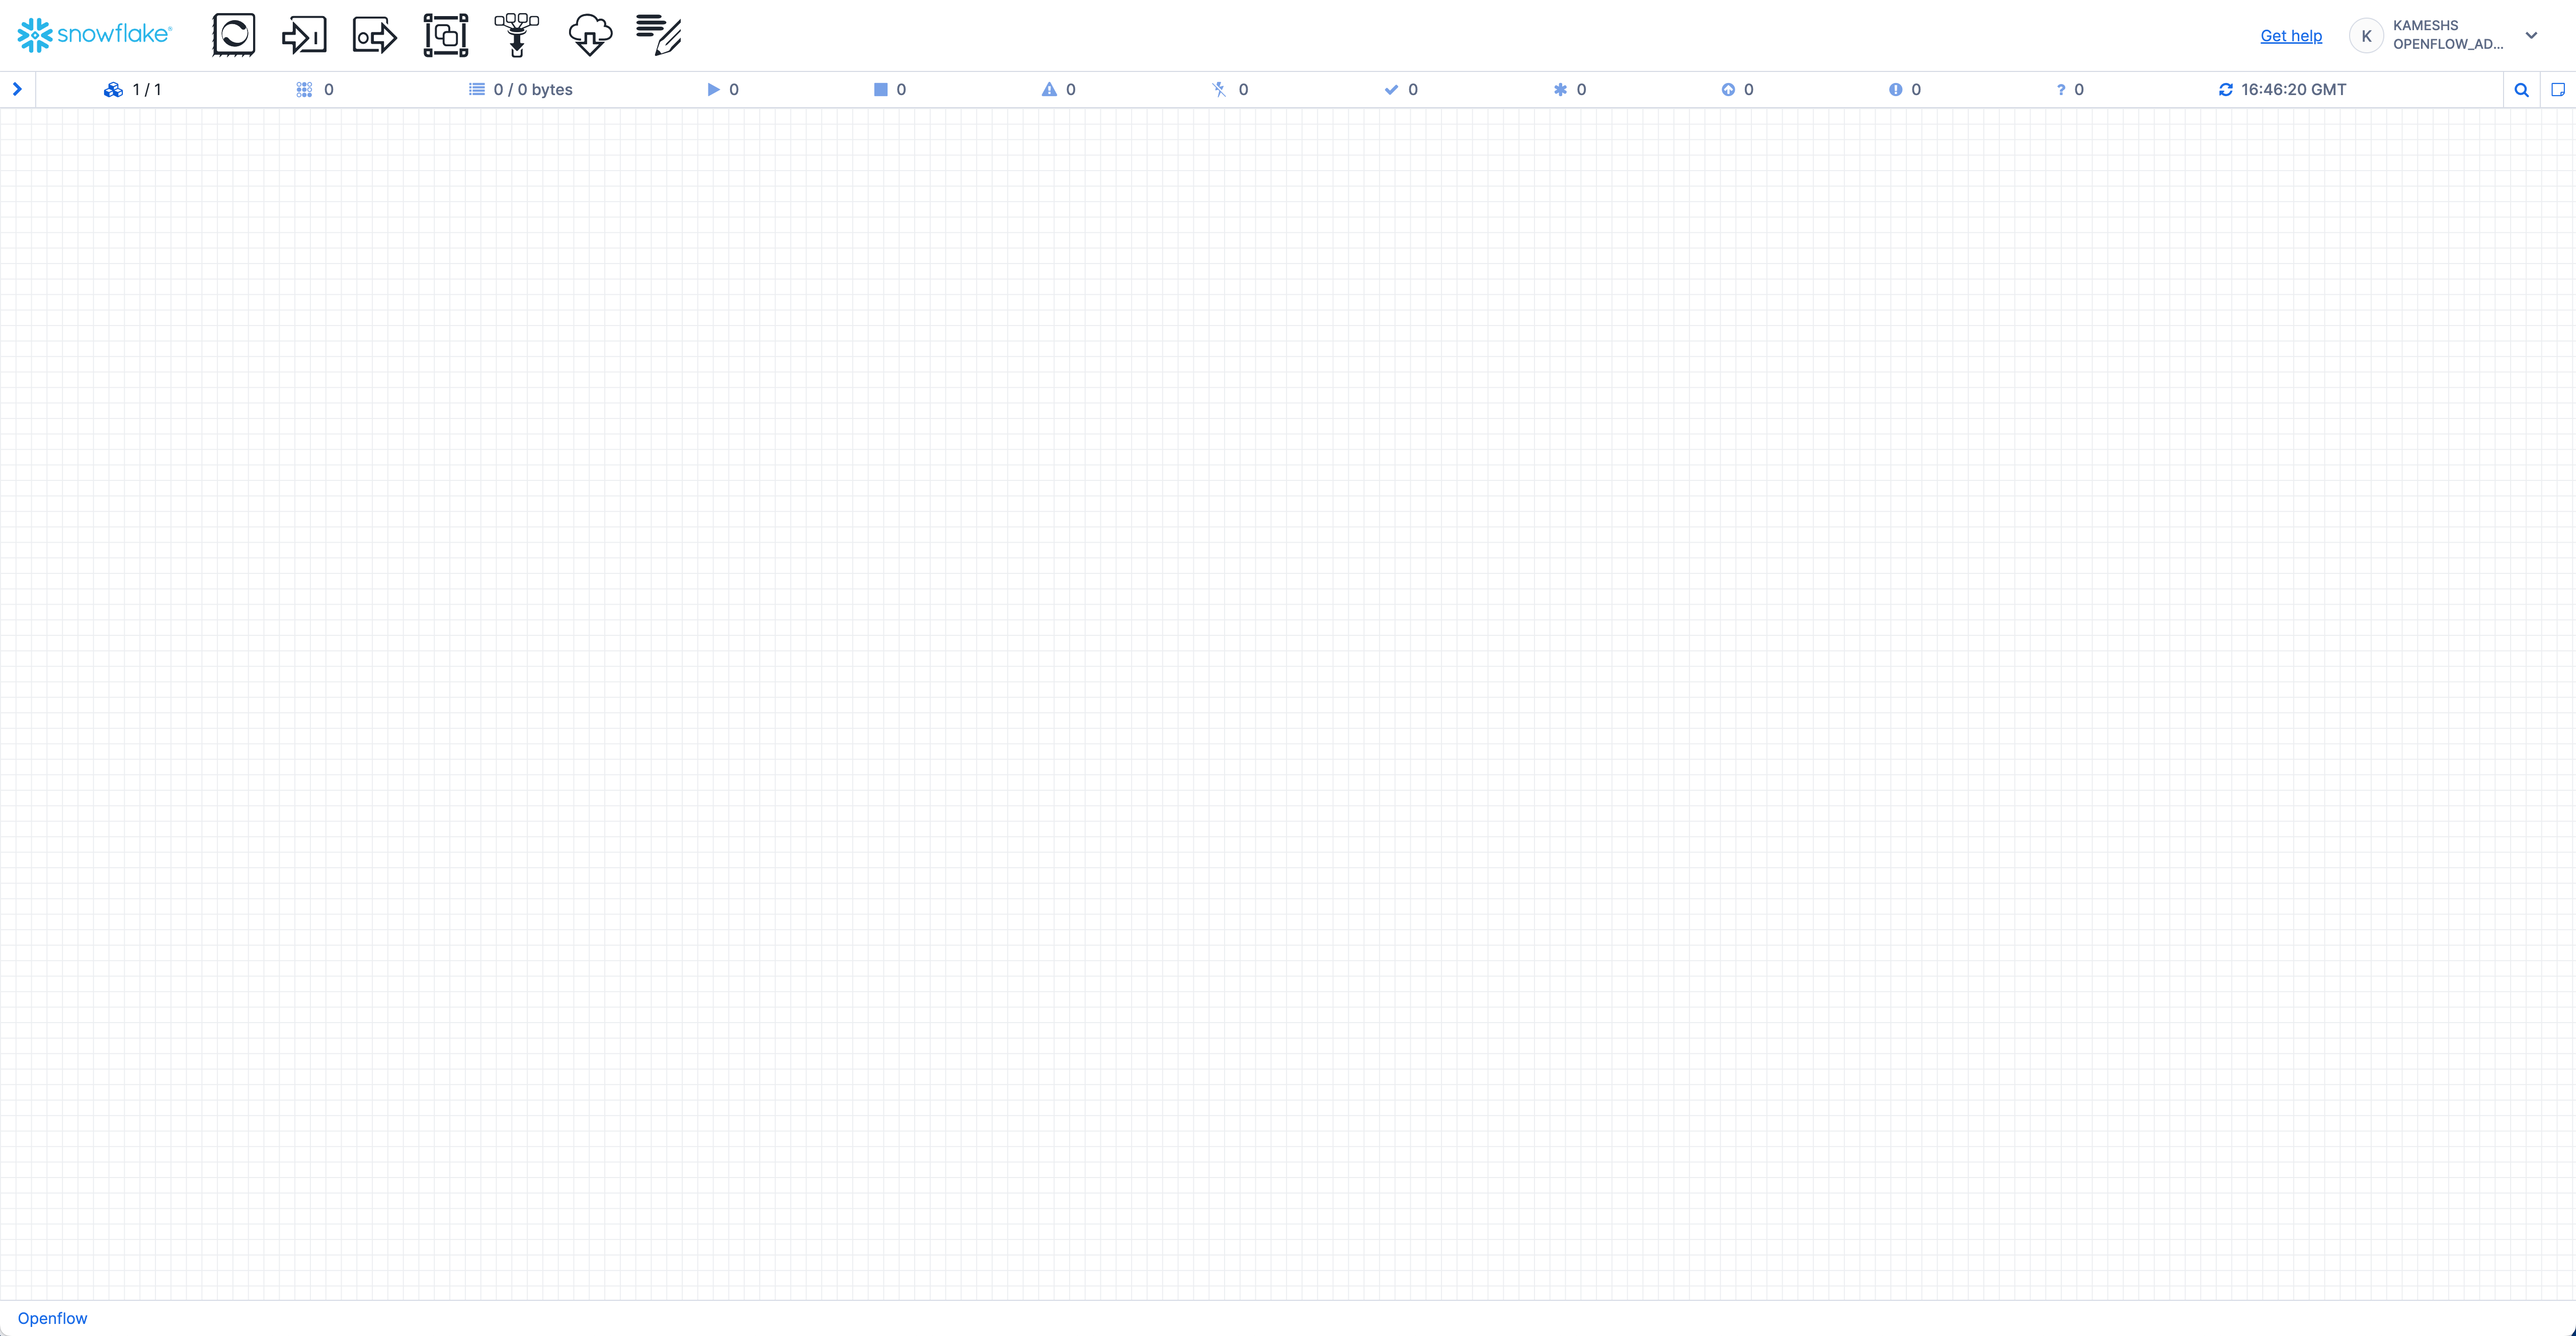
Navigate to your Openflow runtime canvas. In Snowsight's Openflow UI, you can access the canvas by clicking on the runtime name from the Overview page.
Openflow Database CDC Connectors
While this quickstart focuses on PostgreSQL, the concepts and workflow apply to all Openflow database CDC connectors. Openflow provides CDC connectors for major relational databases, enabling real-time replication of database tables into Snowflake for comprehensive, centralized reporting.
Supported Databases
- PostgreSQL: Versions 11-17 (Standard, AWS RDS, Amazon Aurora, GCP Cloud SQL, Azure Database) - Used in this quickstart
- MySQL: Versions 8.0, 8.4 (Standard, AWS RDS, Amazon Aurora, GCP Cloud SQL)
- SQL Server: SQL Server 2017+ (Standard, AWS RDS, Azure SQL Database)
Why Use Openflow for CDC
Openflow provides a unified platform for CDC across all major databases with consistent workflows and metadata, whether you're using PostgreSQL, MySQL, SQL Server, or Oracle (coming soon).
Add PostgreSQL Connector to Runtime
Navigate to Work with data → Ingestion → Openflow → Overview. Follow the animation below to add the PostgreSQL connector to your runtime:
The PostgreSQL connector is now on your canvas. It includes all the processors and services needed for snapshot load and incremental CDC from PostgreSQL to Snowflake.
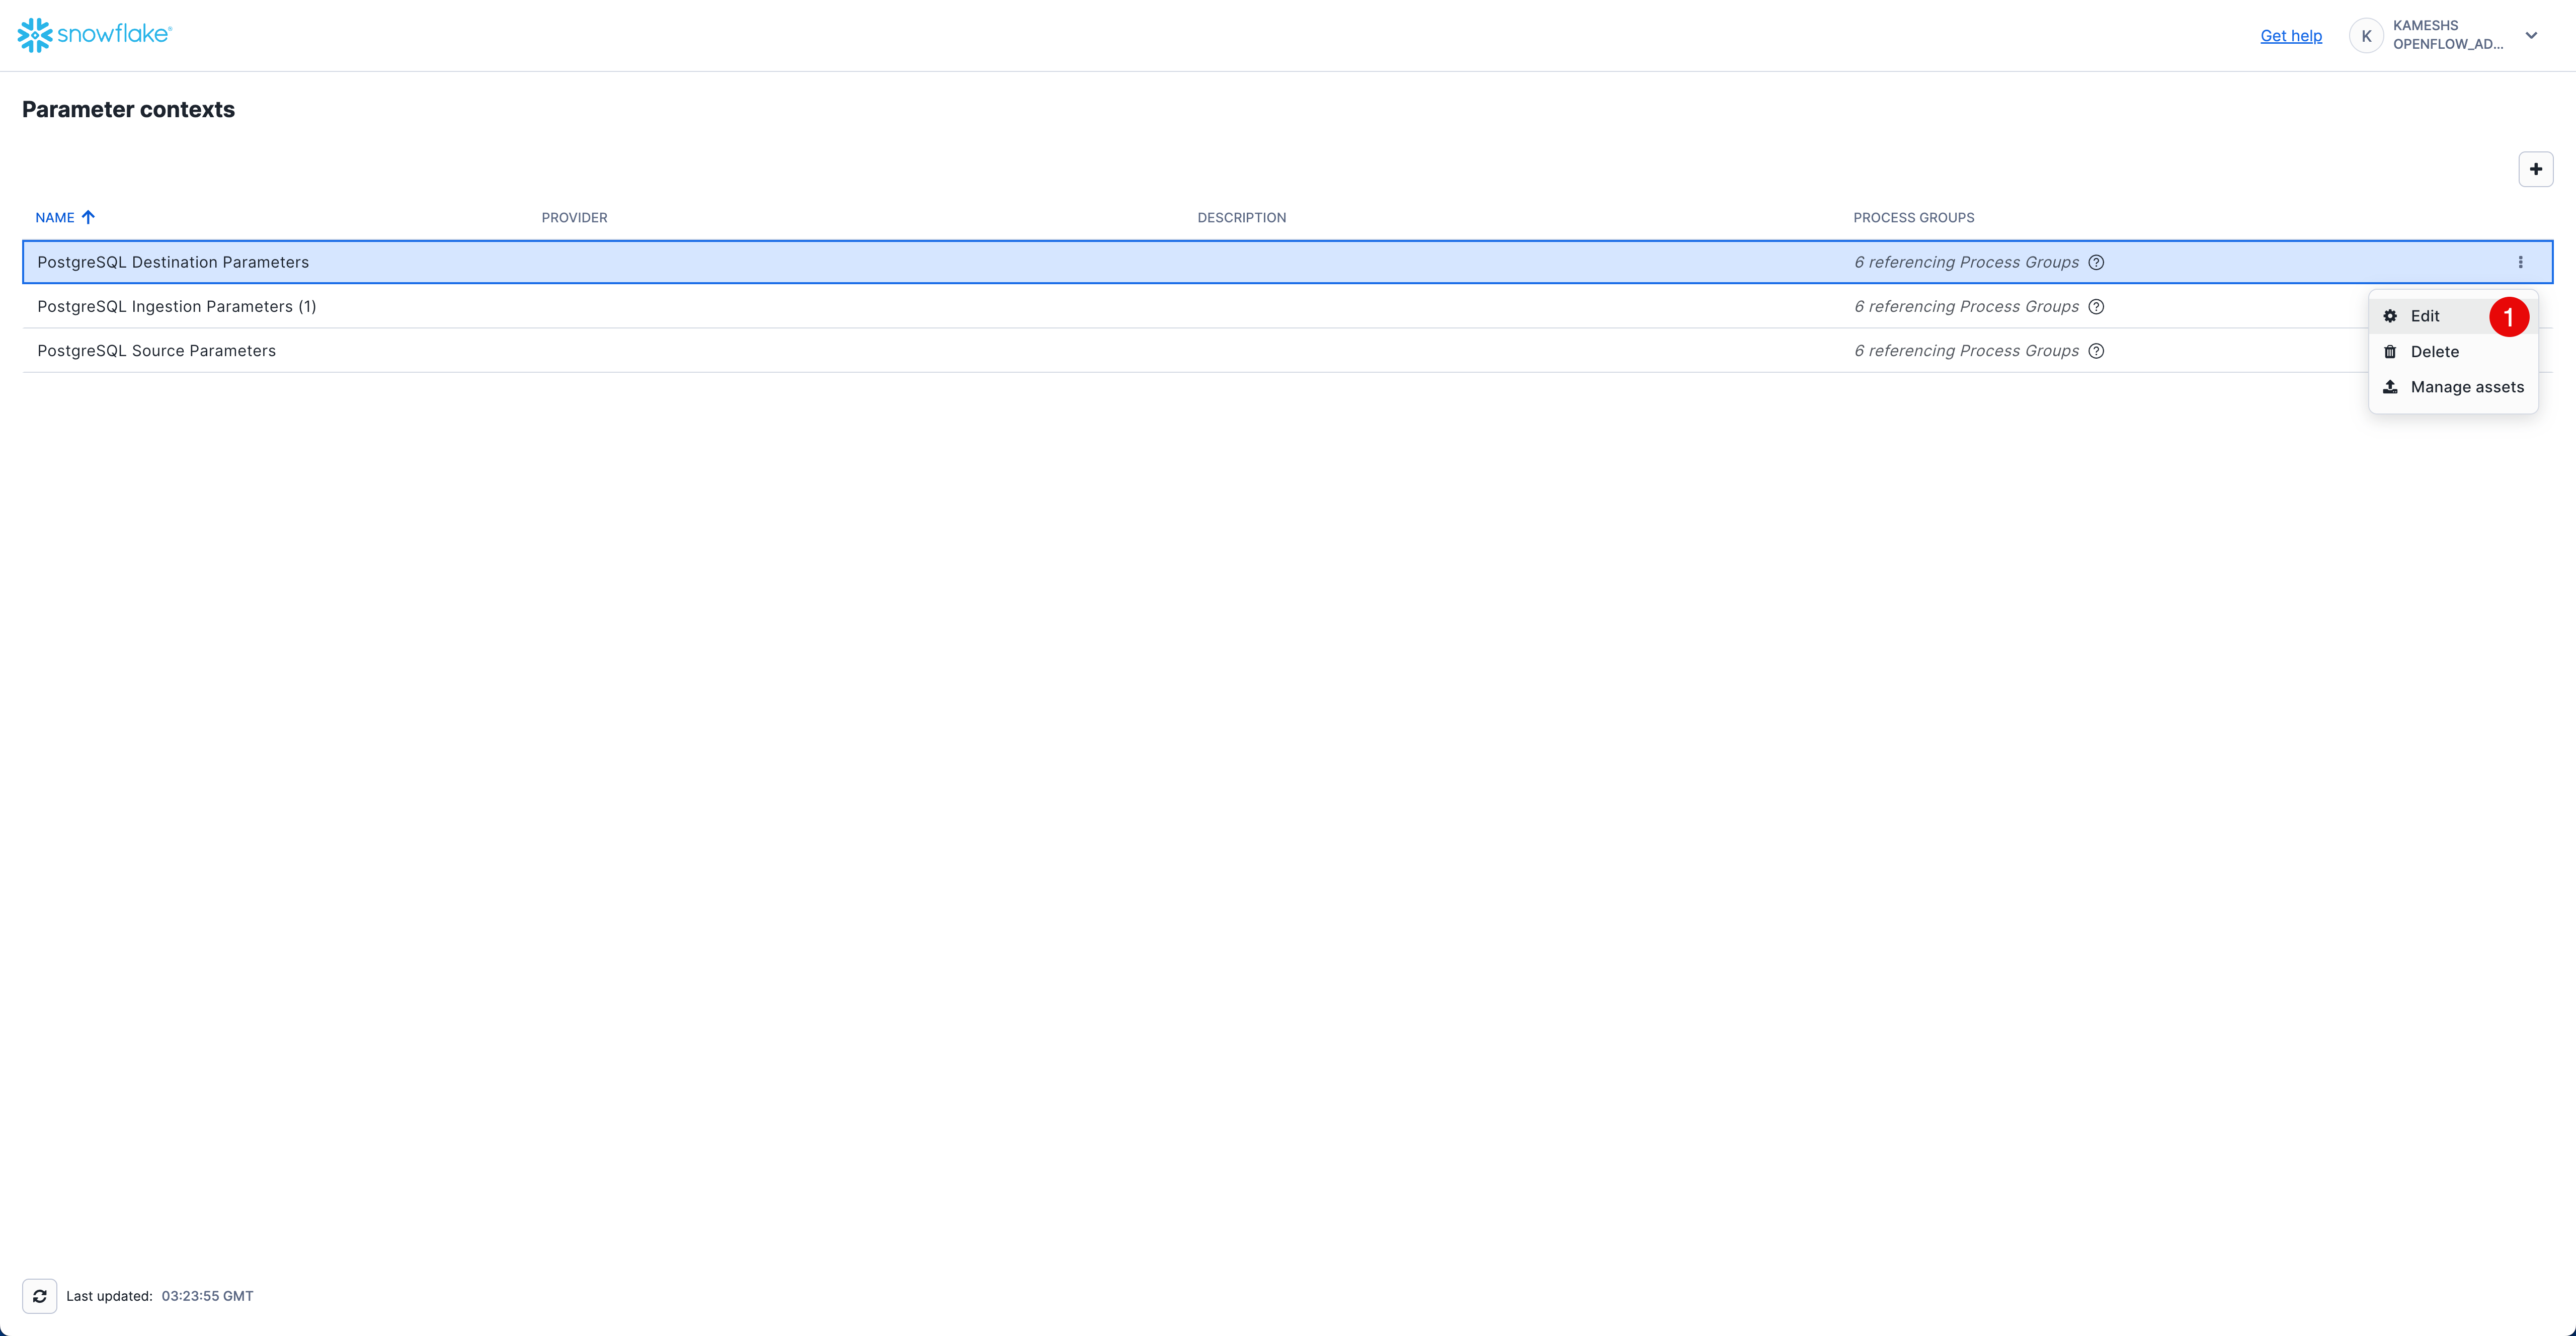
The PostgreSQL connector uses three parameter contexts to organize its configuration:
- PostgreSQL Source Parameters - PostgreSQL connection details and CDC-specific settings like publication and replication slot
- PostgreSQL Destination Parameters - Snowflake table mapping and schema configuration
- PostgreSQL Ingestion Parameters - Schema and columns that need to be loaded into Snowflake
To access parameter contexts:
Configure PostgreSQL Source Parameters
Configure the PostgreSQL database connection details and CDC-specific settings.
Download PostgreSQL JDBC Driver
Before configuring the parameters, download the PostgreSQL JDBC driver that will be used for the database connection.
Get the PostgreSQL JDBC driver from https://jdbc.postgresql.org/download/
- This quickstart uses
postgresql-42.7.7.jar(you can use any recent version)
You'll upload this JAR file as a reference asset so the connector can use it to connect to PostgreSQL.
Access PostgreSQL Source Parameters
From the Parameter contexts list, click the three dots menu (⋮) next to PostgreSQL Source Parameters and select Edit.
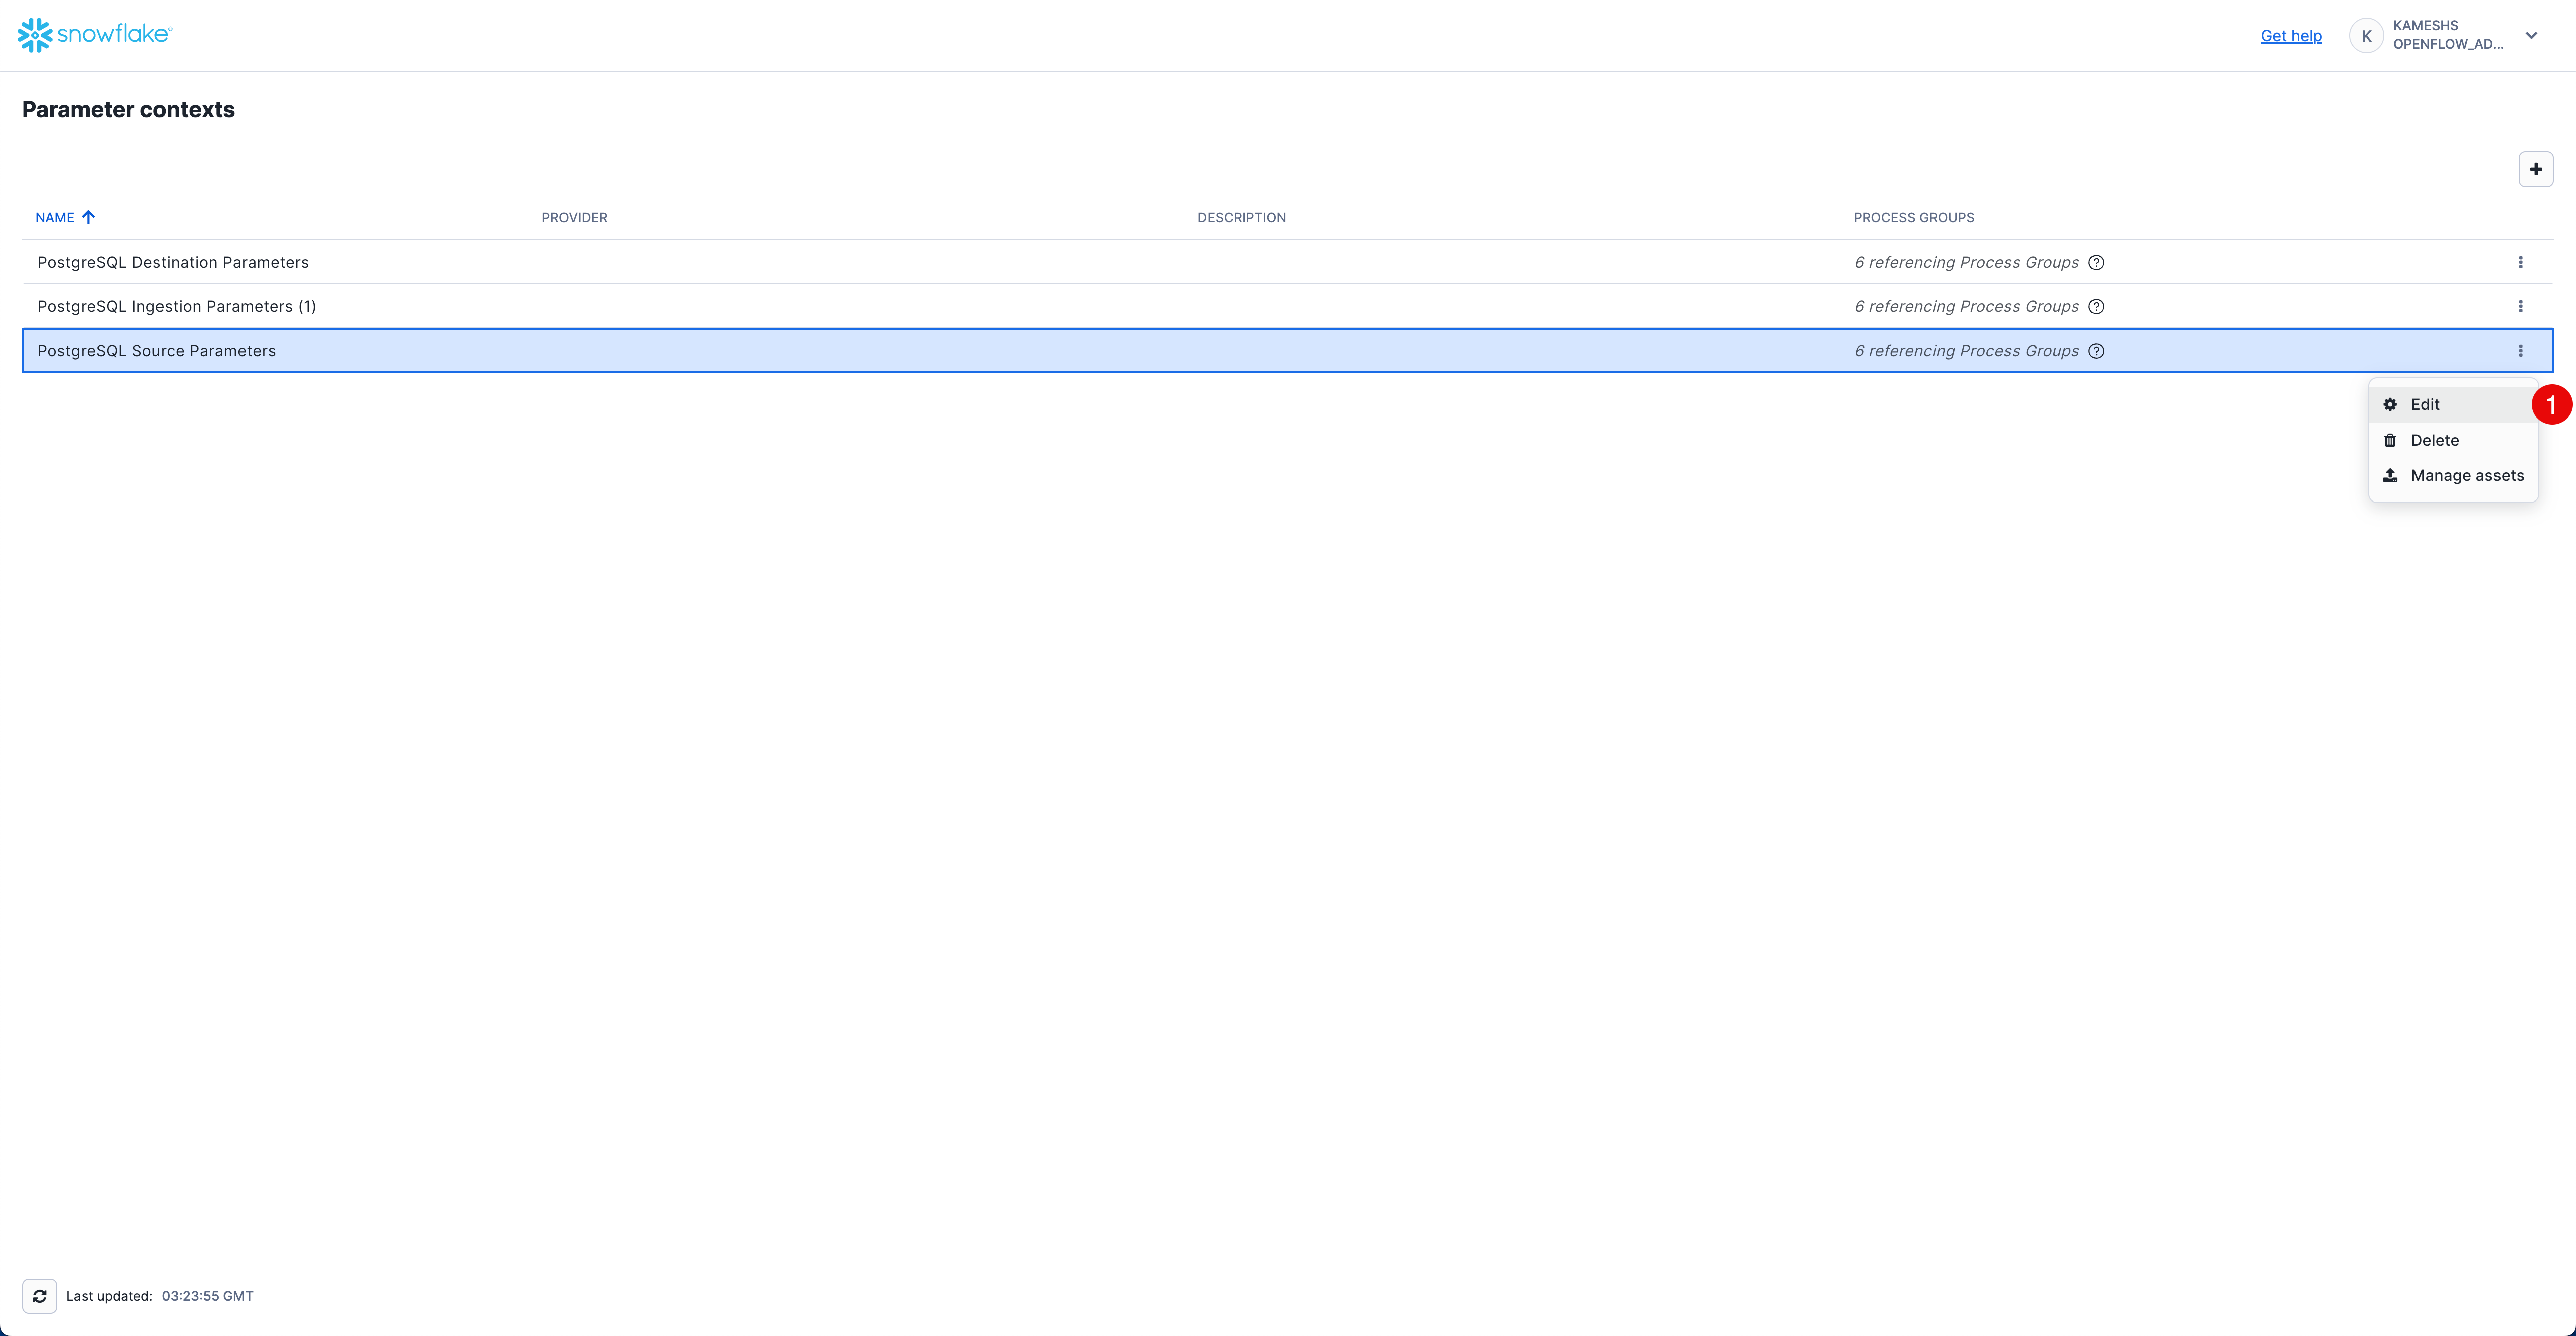
Click on the Parameters tab and configure the following values:
Parameter | Value | Description |
PostgreSQL Connection URL |
| JDBC connection URL to your PostgreSQL instance. Replace |
PostgreSQL JDBC Driver |
| Reference to the PostgreSQL JDBC driver JAR (see upload instructions below) |
PostgreSQL Password | Password for the PostgreSQL user (stored as sensitive value) | |
PostgreSQL Username |
| PostgreSQL username (or the user you configured with REPLICATION privileges) |
Publication Name |
| Name of the PostgreSQL publication created in 0.init_healthcare.sql |
Replication Slot Name | Leave empty for auto-generation | Optional. If specified, this exact name will be used for the replication slot. If left empty, Openflow automatically generates a unique name following the pattern |
Upload JDBC Driver as Reference Asset
Follow the animation below to upload the downloaded JAR file and reference it in the PostgreSQL JDBC Driver parameter:
Your completed configuration should look like this:
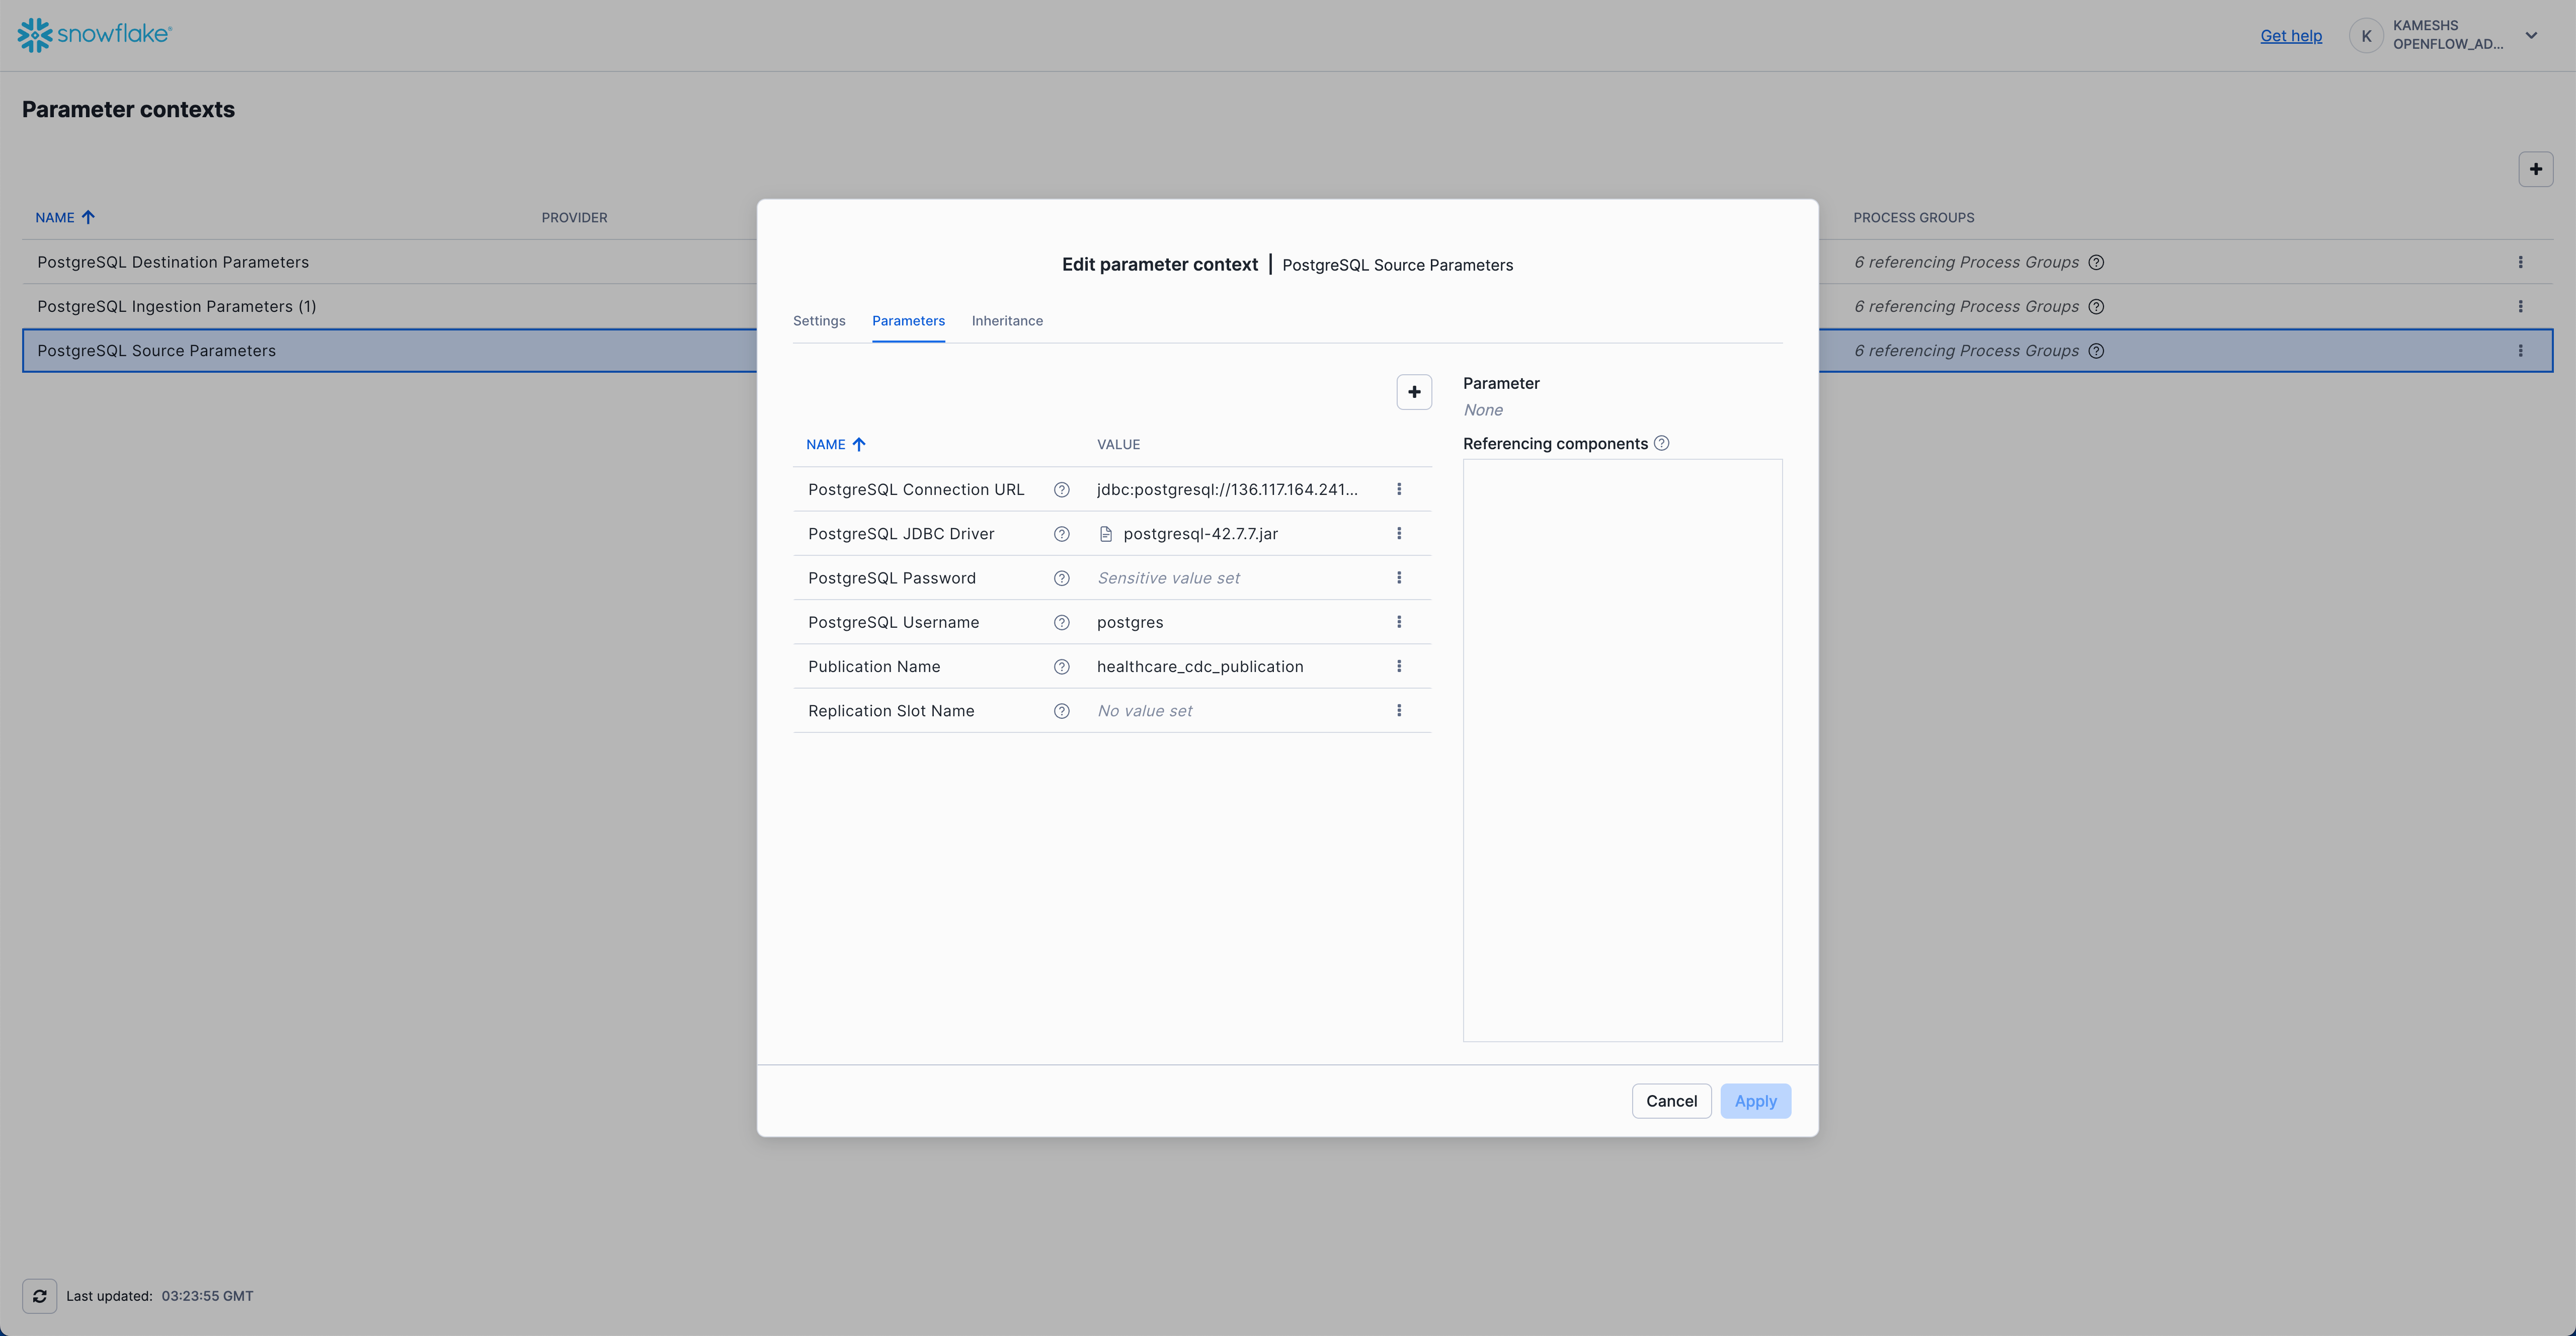
Click Apply to save your PostgreSQL source parameters configuration.
Configure PostgreSQL Destination Parameters
Configure the Snowflake destination connection where PostgreSQL data will be replicated.
Access PostgreSQL Destination Parameters
From the Parameter contexts list, click the three dots menu (⋮) next to PostgreSQL Destination Parameters and select Edit.
Click on the Parameters tab and configure the following values:
Parameter | Value | Description |
Destination Database |
| Snowflake database where tables will be created (defined in 1.snowflake_setup.sql#L23) |
Snowflake Account Identifier | Leave empty | Not required when using session token authentication |
Snowflake Authentication Strategy |
| Uses the runtime's session for authentication (recommended for SPCS deployments) |
Snowflake Private Key | Leave empty | Not required when using session token authentication |
Snowflake Private Key File | Leave empty | Not required when using session token authentication |
Snowflake Private Key Password | Leave empty | Not required when using session token authentication |
Snowflake Role |
| Runtime role with permissions to create tables and write data (defined in 1.snowflake_setup.sql#L20) |
Snowflake Username | Leave empty | Not required when using session token authentication |
Snowflake Warehouse |
| Warehouse for data processing (defined in 1.snowflake_setup.sql#L26) |
Your completed configuration should look like this:
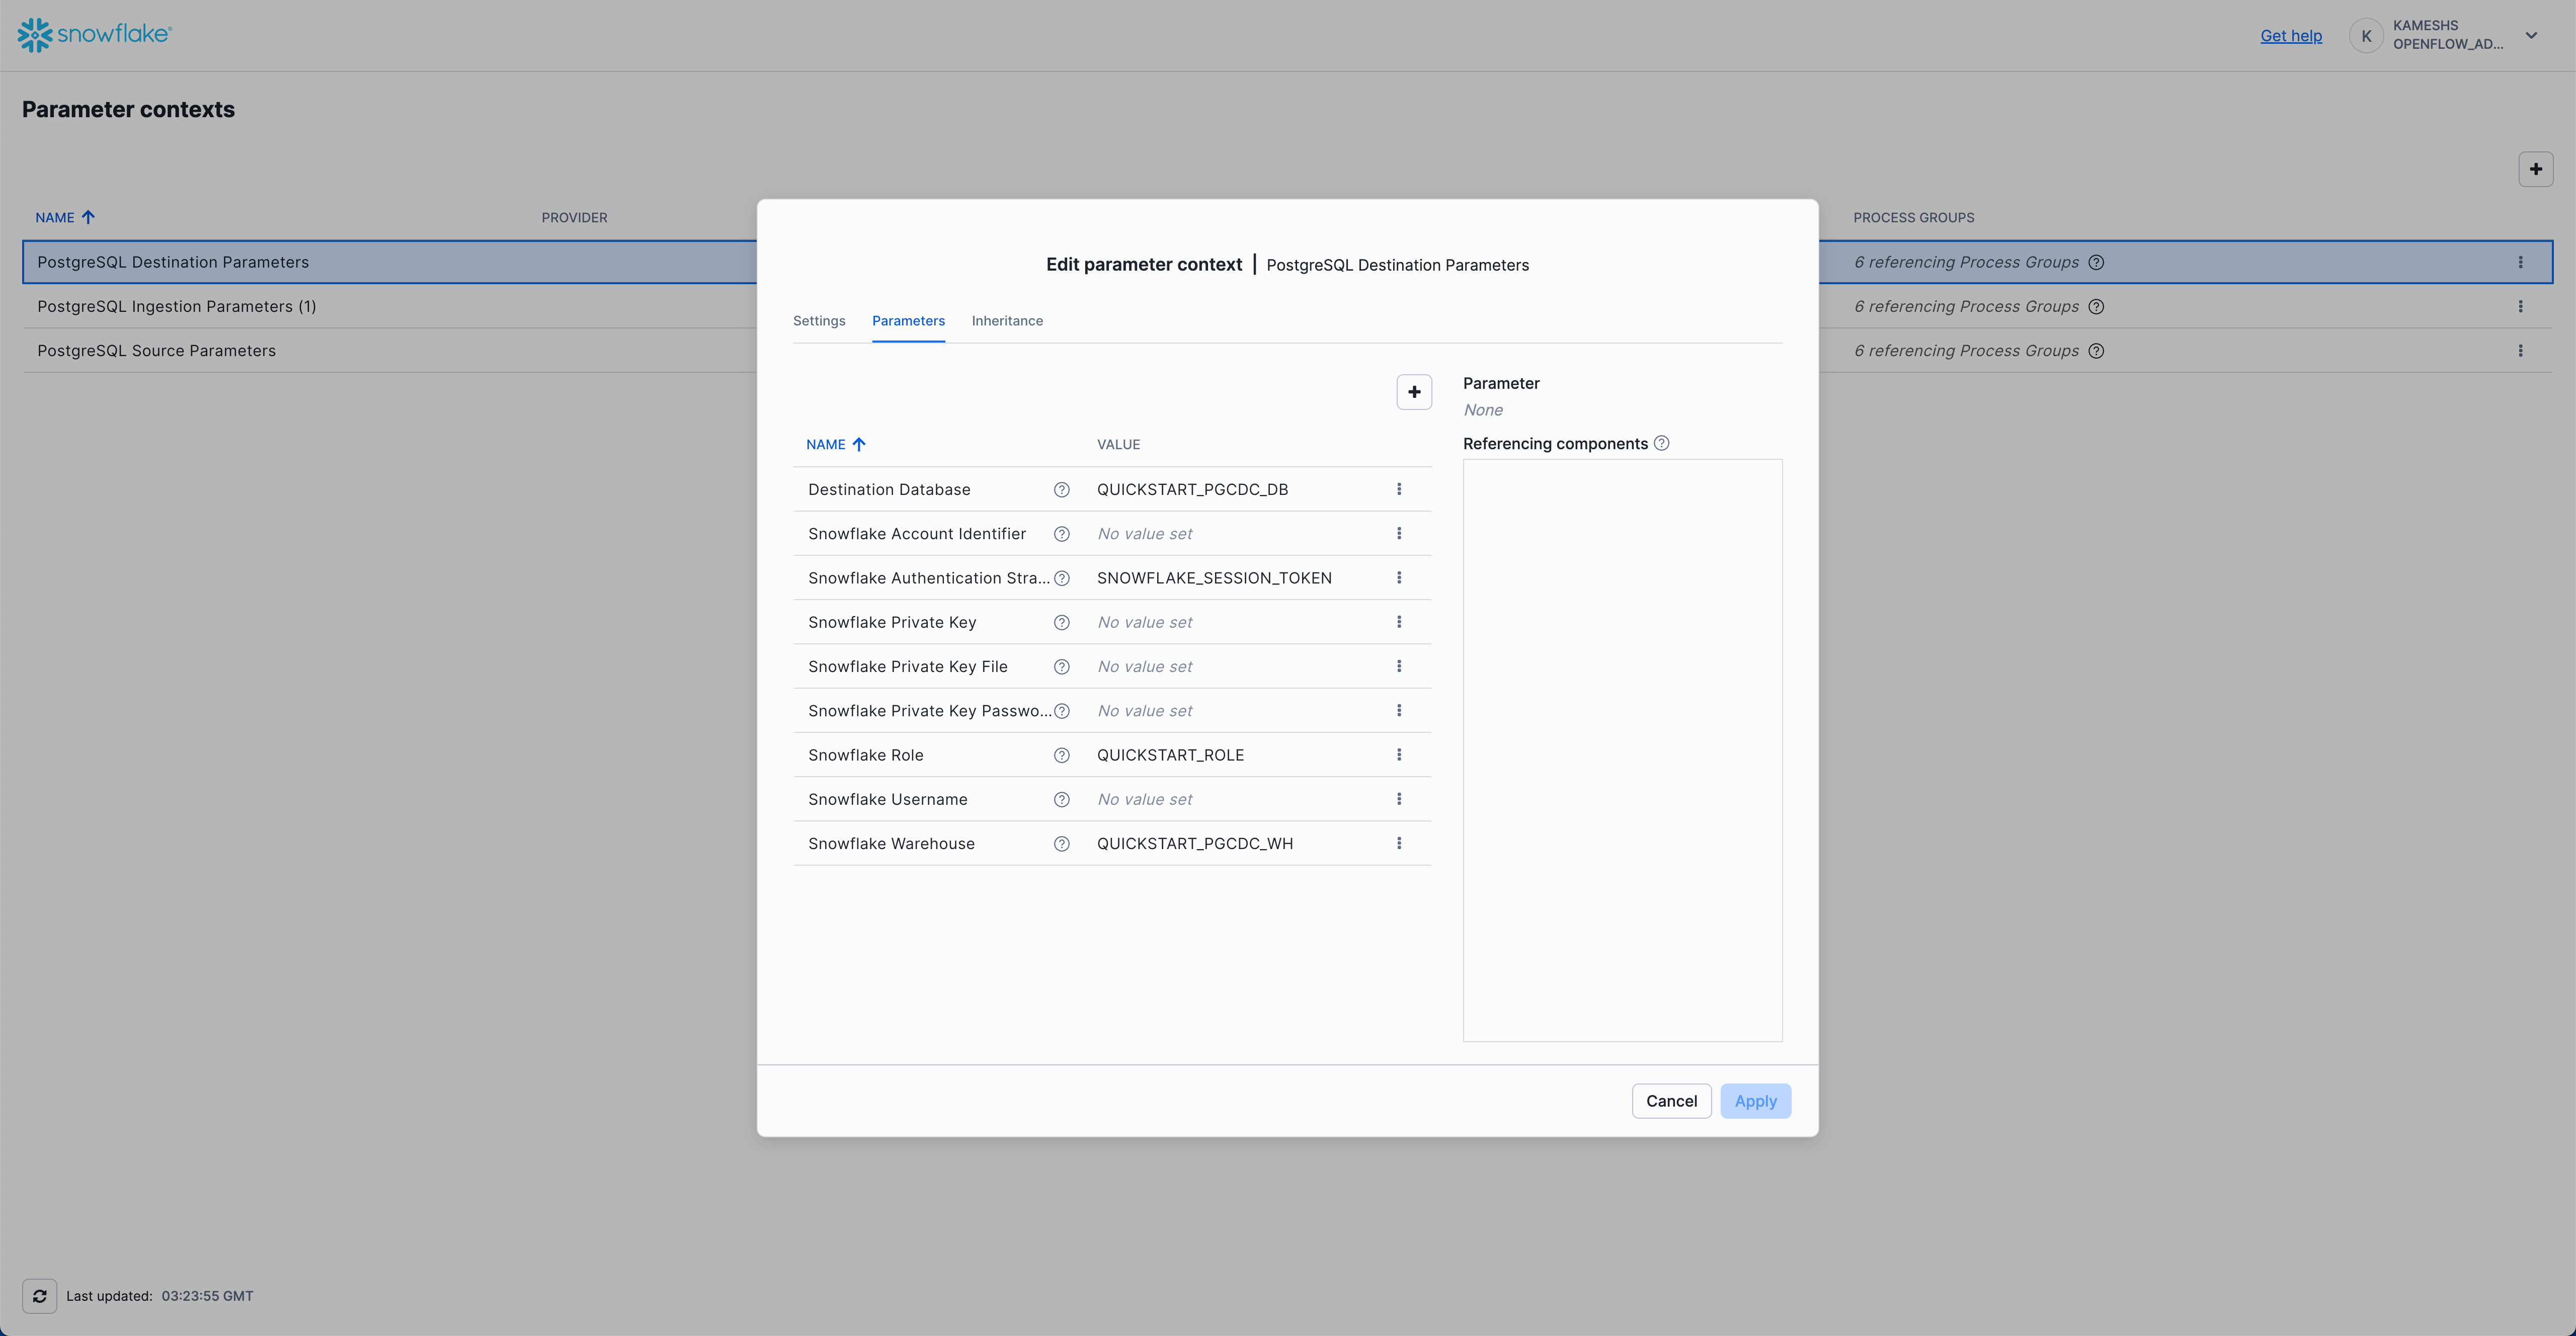
Click Apply to save your PostgreSQL destination parameters configuration.
Configure PostgreSQL Ingestion Parameters
Configure CDC ingestion settings and table filters. This parameter context inherits values from both PostgreSQL Source Parameters and PostgreSQL Destination Parameters.
Access PostgreSQL Ingestion Parameters
From the Parameter contexts list, click the three dots menu (⋮) next to PostgreSQL Ingestion Parameters (1) and select Edit.
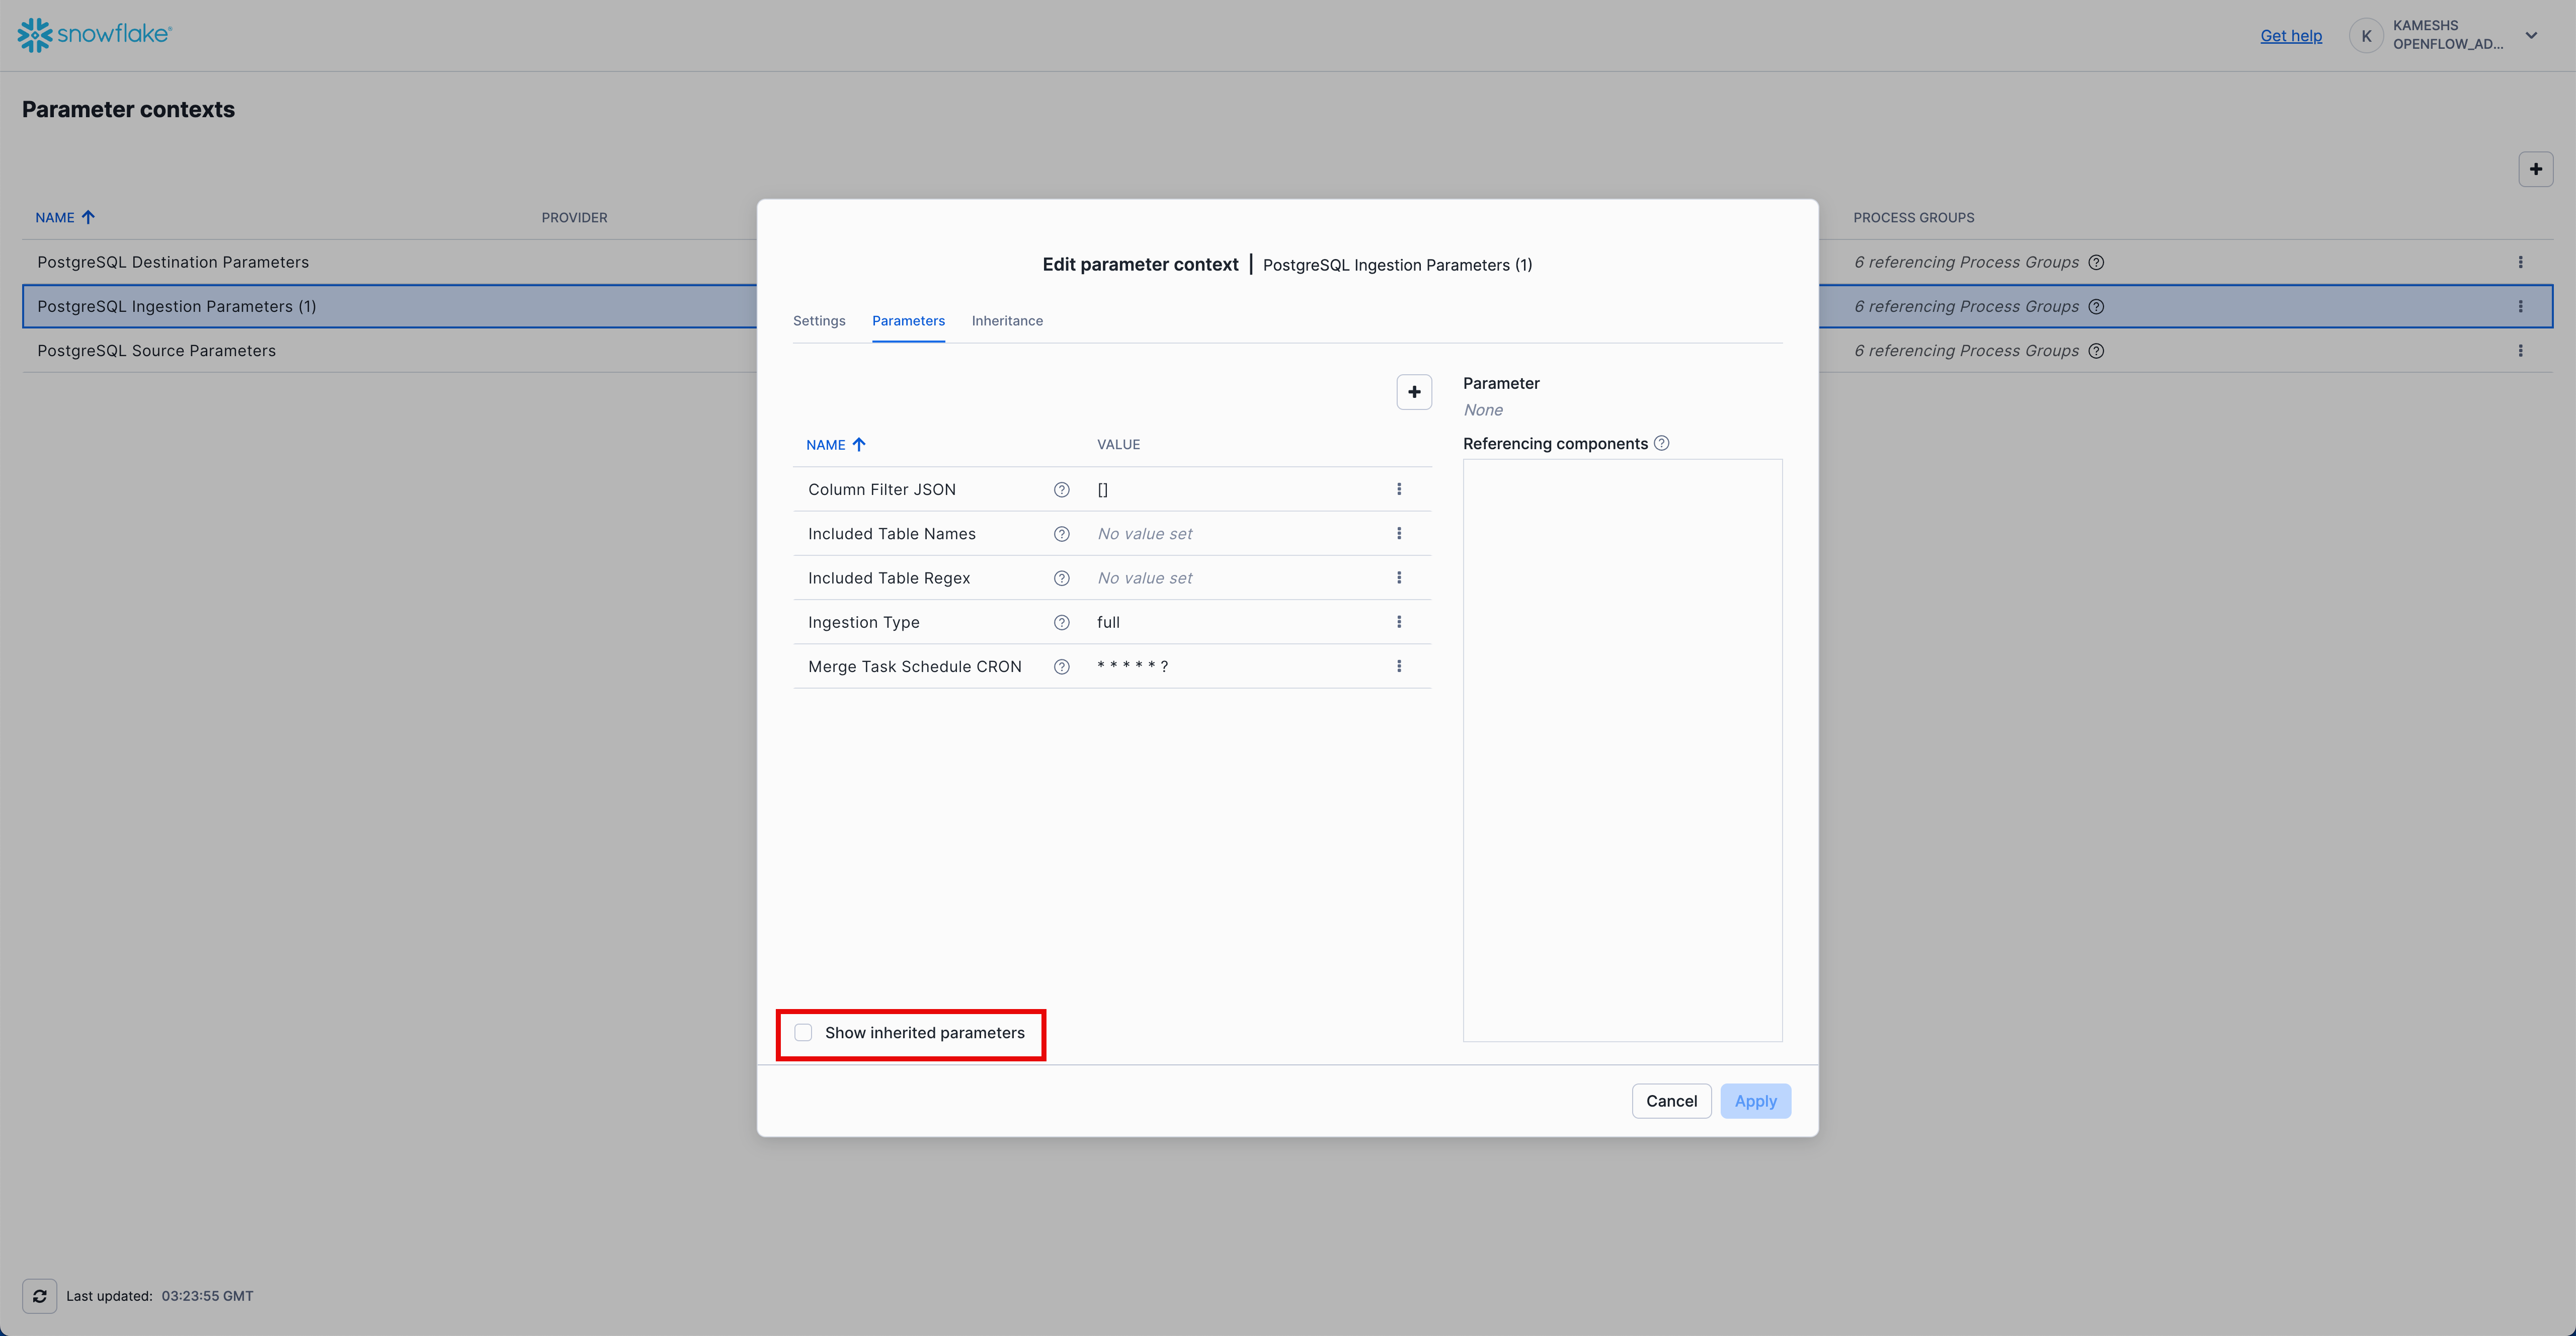
Click on the Parameters tab. By default, you'll see only the parameters specific to this context. To view all parameters (including inherited ones), check the Show inherited parameters checkbox at the bottom.
Configure the following key parameters:
Parameter | Value | Description |
Column Filter JSON |
| Empty array means all columns are included |
Included Table Names | Leave empty | Use regex instead for flexible filtering |
Included Table Regex |
| Regular expression to match table names for CDC. The pattern |
Ingestion Type |
| Performs full snapshot followed by incremental CDC. Other option is "incremental" which only performs incremental CDC, existing data is not loaded. |
Merge Task Schedule CRON |
| Runs merge tasks every second for near real-time updates |
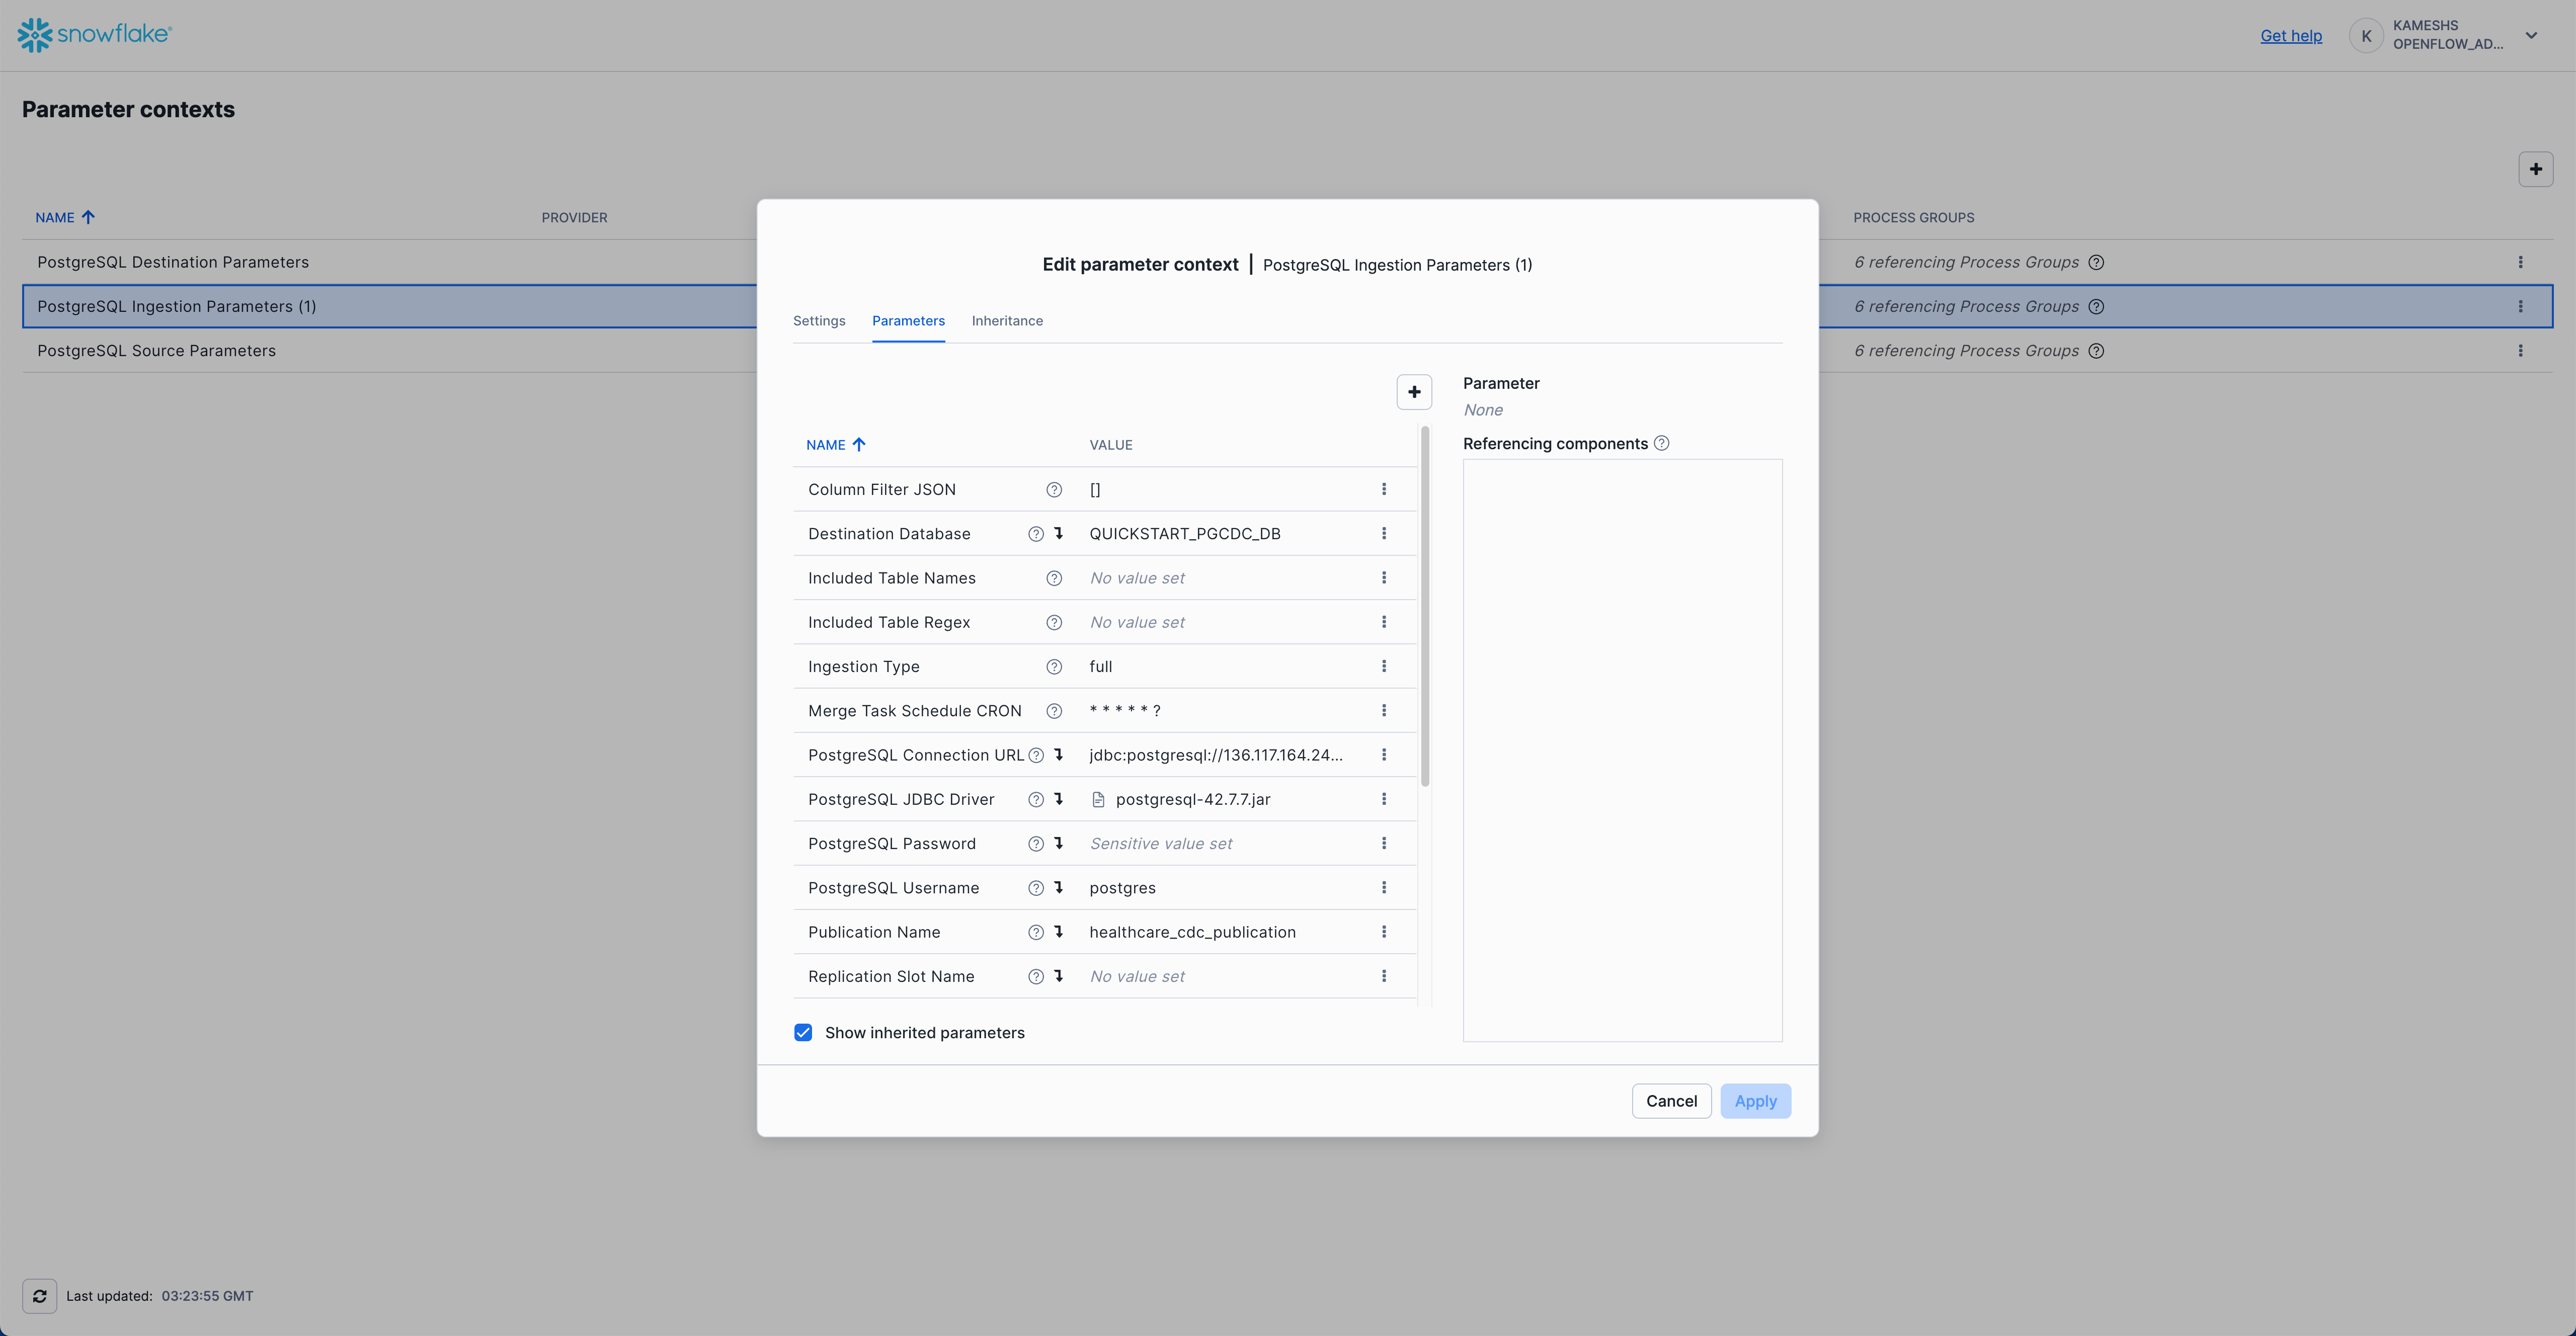
Inherited Parameters (visible when "Show inherited parameters" is checked):
From PostgreSQL Source Parameters:
- PostgreSQL Connection URL
- PostgreSQL JDBC Driver
- PostgreSQL Username
- PostgreSQL Password
- Publication Name (
healthcare_cdc_publication- created in 0.init_healthcare.sql#L348) - Replication Slot Name (auto-generated)
From PostgreSQL Destination Parameters:
- Destination Database
- Snowflake Role
- Snowflake Warehouse
- Snowflake Authentication Strategy
Your completed configuration with inherited parameters should look like this:
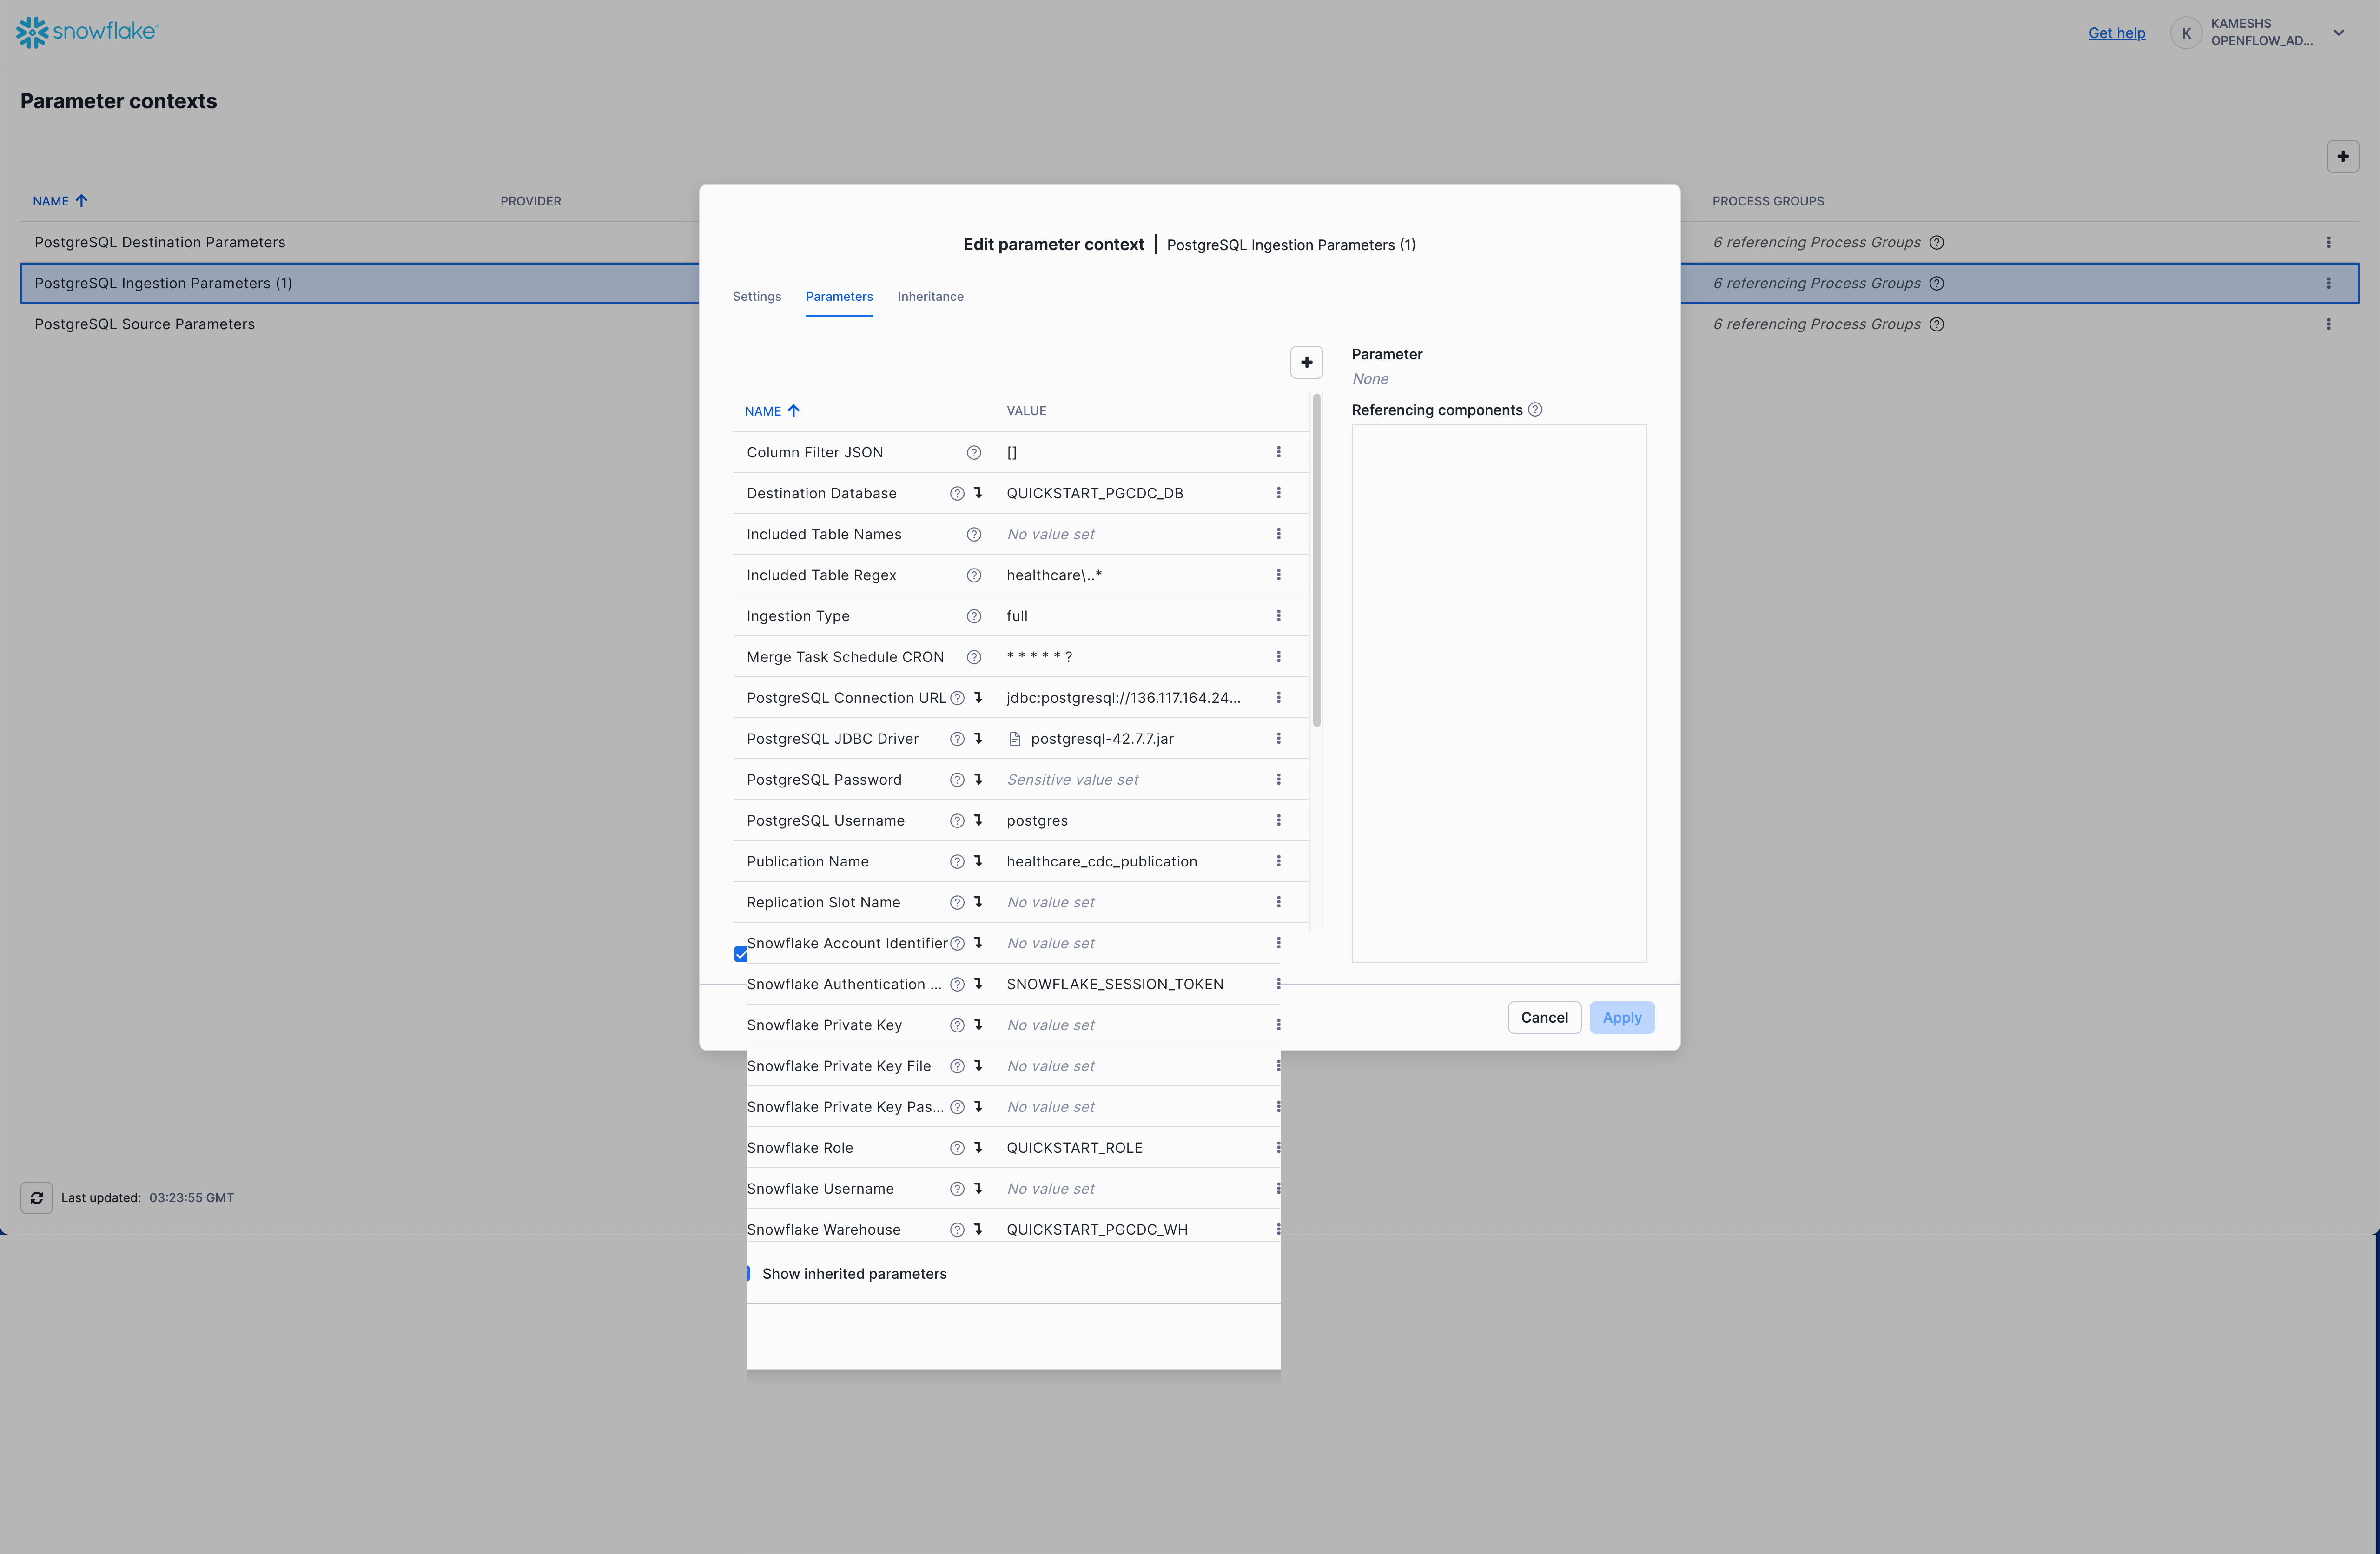
Click Apply to save your PostgreSQL ingestion parameters configuration.
With all three parameter contexts configured, you're now ready to start the CDC pipeline!
With the connector configured, you're now ready to start the CDC pipeline and verify that the initial snapshot is loaded correctly.
Enable Services and Start Connector
Before starting the connector, you need to enable the controller services that manage the CDC replication process.
Follow these steps to enable services and start the connector:
- Open Controller Services: Right-click on the canvas and select "Configure"
- Enable Services: Enable the two controller services (State Provider and Database Connection Pool)
- Start Process Groups: Right-click on the process groups and start them
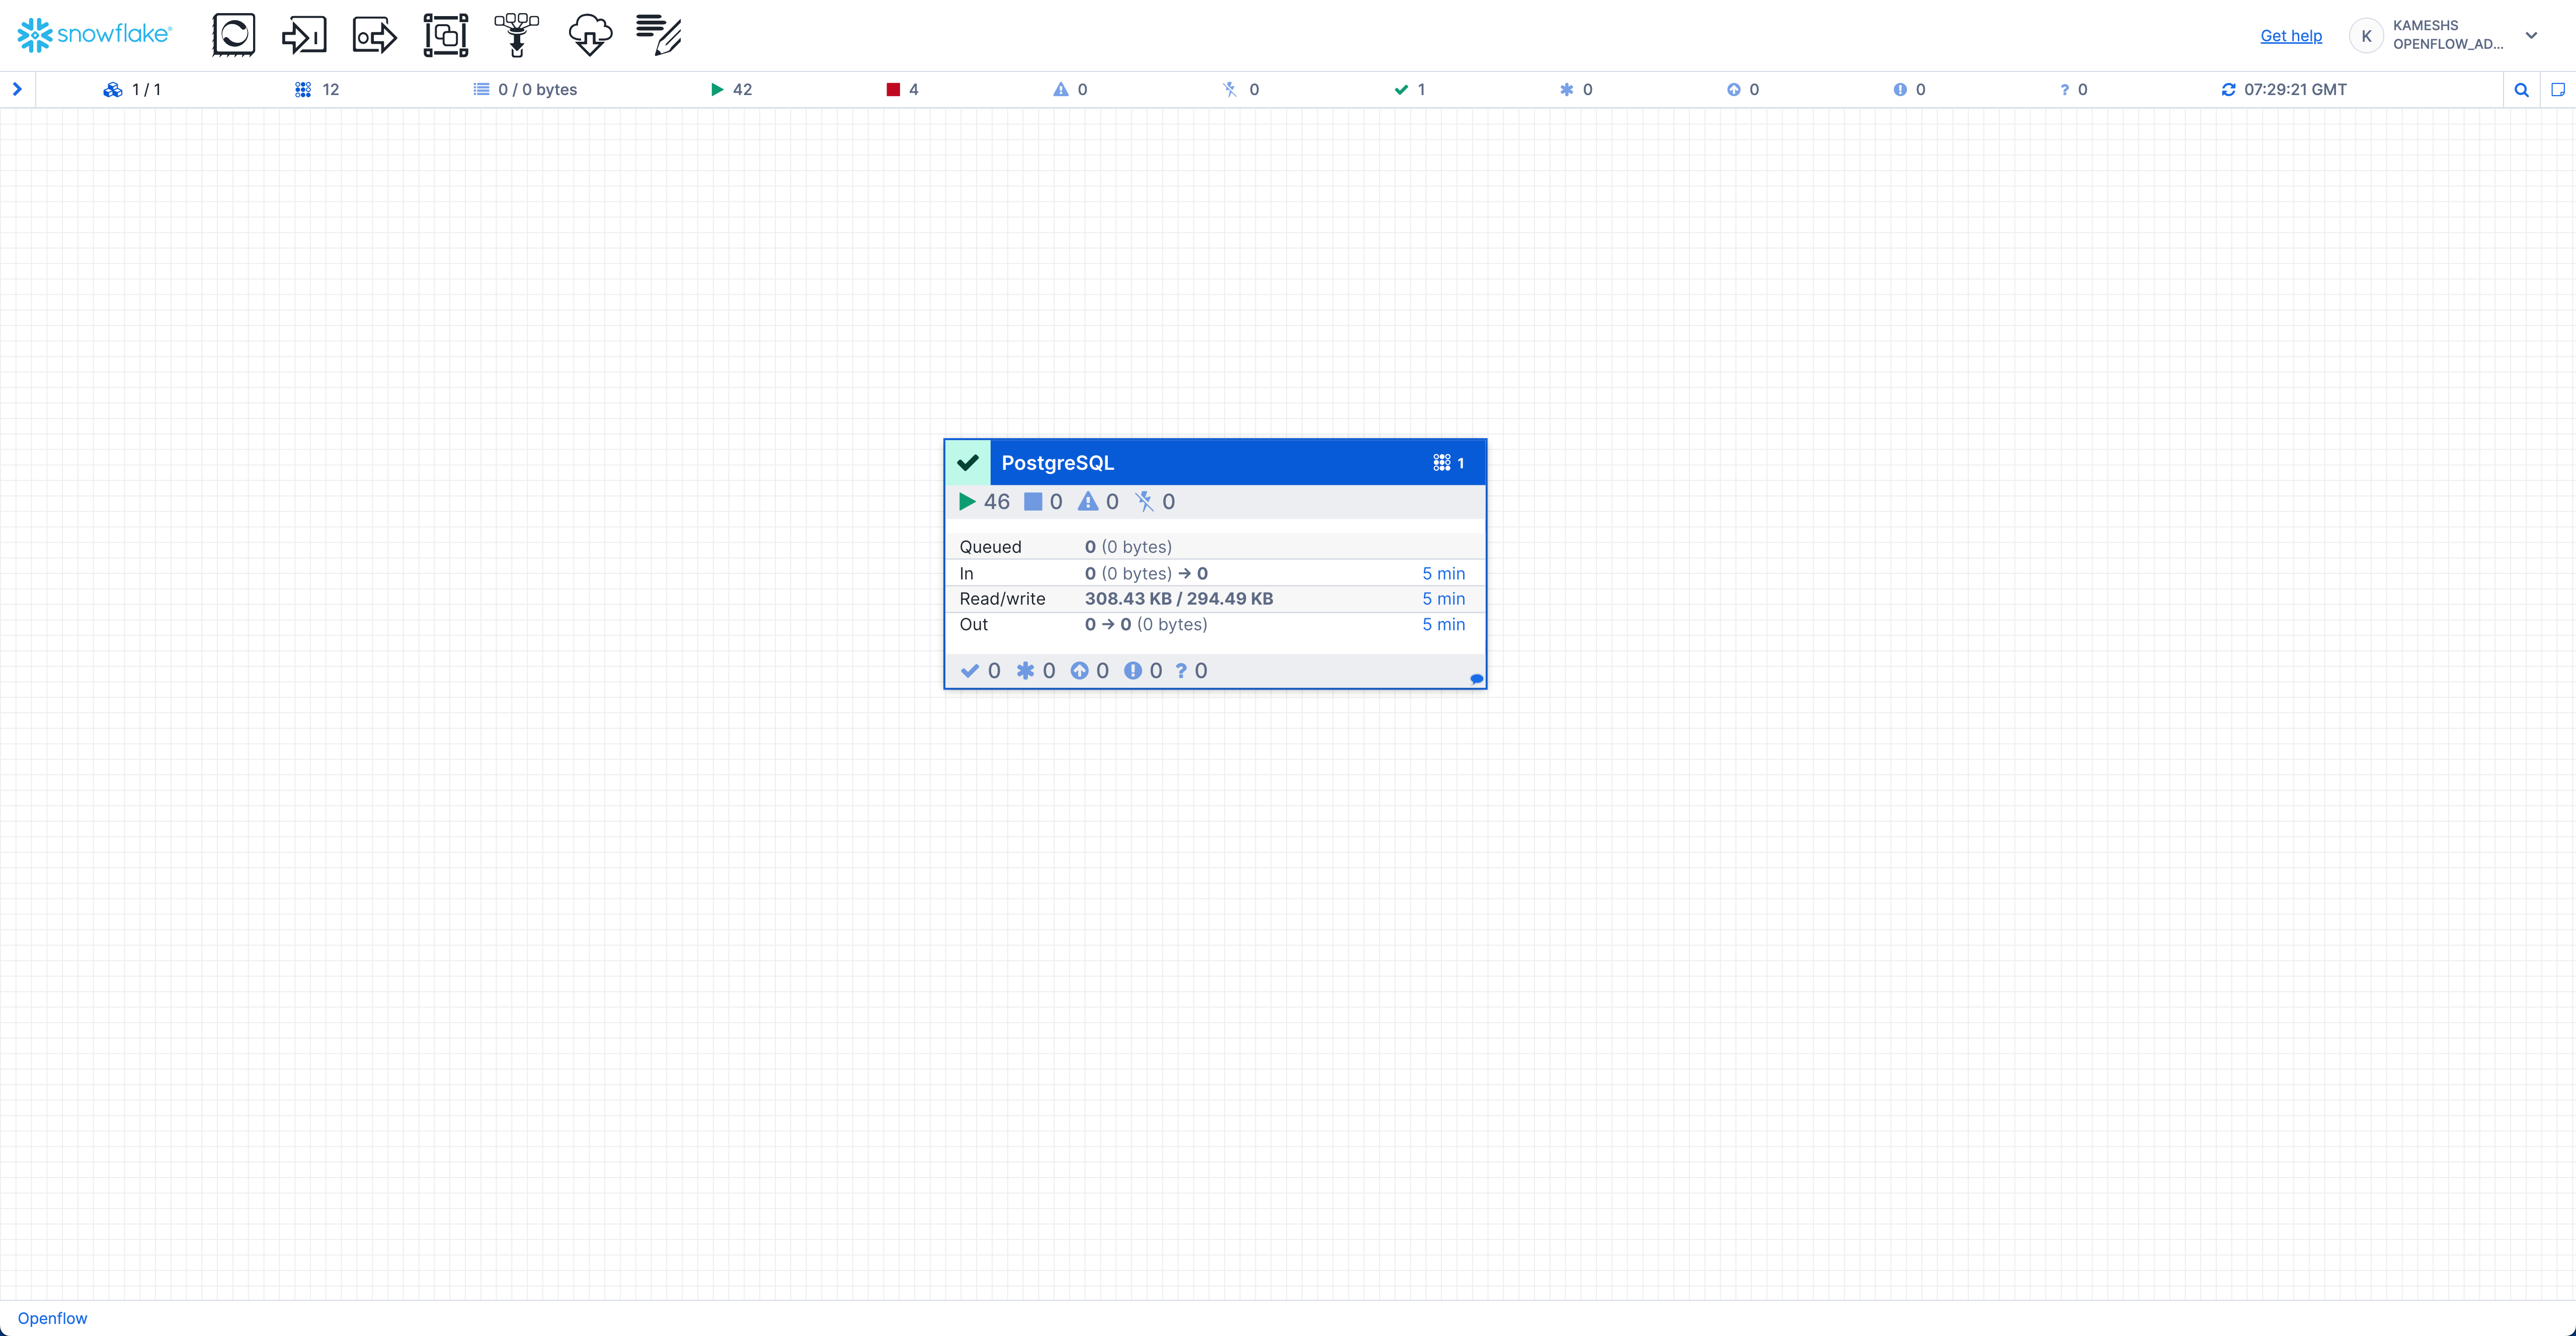
- Monitor Progress: Watch the connector flow execute the snapshot load
Once the services are running, your connector status should show all components active:
Verify Data in Snowflake
After the snapshot completes, verify that the data was loaded successfully in Snowflake.
Check Record Counts
Run the following query in Snowsight to verify all tables were created and populated:
USE ROLE QUICKSTART_ROLE;
USE DATABASE QUICKSTART_PGCDC_DB;
USE SCHEMA "healthcare";
USE WAREHOUSE QUICKSTART_PGCDC_WH;

SELECT 'patients' as table_name, COUNT(*) as record_count FROM "patients"
UNION ALL
SELECT 'doctors', COUNT(*) FROM "doctors"
UNION ALL
SELECT 'appointments', COUNT(*) FROM "appointments"
UNION ALL
SELECT 'visits', COUNT(*) FROM "visits"
ORDER BY table_name;
Expected output:
+----------------+--------------+
| TABLE_NAME     | RECORD_COUNT |
+----------------+--------------+
| APPOINTMENTS   |          170 |
| DOCTORS        |           10 |
| PATIENTS       |          100 |
| VISITS         |          100 |
+----------------+--------------+
Verify CDC Metadata
Check that CDC metadata columns are present and confirm the snapshot was loaded:
SELECT
    COUNT(*) as total_rows,
    MIN(_SNOWFLAKE_INSERTED_AT) as earliest_inserted,
    MAX(_SNOWFLAKE_INSERTED_AT) as latest_inserted,
    COUNT(DISTINCT _SNOWFLAKE_INSERTED_AT) as unique_insert_timestamps
FROM "appointments";
Expected output (timestamps will vary):
+------------+---------------------------+---------------------------+---------------------------+
| TOTAL_ROWS | EARLIEST_INSERTED         | LATEST_INSERTED           | UNIQUE_INSERT_TIMESTAMPS  |
+------------+---------------------------+---------------------------+---------------------------+
|        170 | 2025-10-08 10:15:33.000   | 2025-10-08 10:15:45.000   |                        10 |
+------------+---------------------------+---------------------------+---------------------------+
This confirms that all 170 appointments were successfully loaded during the snapshot phase.
Verify Appointment Status Distribution
Check the distribution of appointment statuses:
SELECT
    "status",
    COUNT(*) as count,
    ROUND(COUNT(*) * 100.0 / SUM(COUNT(*)) OVER (), 2) as percentage
FROM "appointments"
GROUP BY "status"
ORDER BY count DESC;
Expected output (approximate - actual counts will vary):
+-----------+-------+------------+
| STATUS    | COUNT | PERCENTAGE |
+-----------+-------+------------+
| completed |   100 |      58.82 |
| cancelled |    40 |      23.53 |
| scheduled |    15 |       8.82 |
| no_show   |    10 |       5.88 |
| confirmed |     5 |       2.94 |
+-----------+-------+------------+
Verify Doctor Workload
Check appointment distribution across doctors:
SELECT
    d."first_name" || ' ' || d."last_name" as doctor_name,
    d."specialization",
    d."department",
    COUNT(a."appointment_id") as total_appointments,
    SUM(CASE WHEN a."status" = 'completed' THEN 1 ELSE 0 END) as completed_appointments,
    SUM(CASE WHEN a."status" IN ('scheduled', 'confirmed') THEN 1 ELSE 0 END) as upcoming_appointments
FROM "doctors" d
LEFT JOIN "appointments" a ON d."doctor_id" = a."doctor_id"
GROUP BY d."doctor_id", d."first_name", d."last_name", d."specialization", d."department"
ORDER BY total_appointments DESC
LIMIT 5;
This query shows the top 5 doctors by appointment volume, demonstrating that relational joins work correctly with the replicated data.
Run Additional Verification Queries
For comprehensive verification, run the complete verification script from the companion GitHub repository:
📋 Full Verification Script: 2.verify_snapshot.sql
The full script includes additional checks for:
- Data quality validation (NULL checks)
- Patient demographics analysis
- Revenue summaries by doctor
- Common diagnoses
- Follow-up and prescription statistics
You can run this script directly in Snowsight by copying and pasting the SQL.
Now that the snapshot is loaded, let's set up Snowflake Intelligence before generating CDC events. This allows you to establish a baseline understanding of your data, then observe changes in real-time after running the CDC demo.
What You'll Build
You'll create an AI agent that can answer questions like:
- "Show me doctor workload for today"
- "Which appointments were updated via CDC in the last hour?"
- "What's the revenue by specialization this month?"
- "How many records were soft-deleted today?"
The agent understands your healthcare schema AND the CDC metadata columns for tracking changes!
Prerequisites
Before setting up Snowflake Intelligence, ensure you have:
- ✅ Completed snapshot load with Openflow pipeline running
- ✅ Snowflake Intelligence infrastructure created (this was done in
1.snowflake_setup.sqlwhich created thesnowflake_intelligencedatabase andagentsschema) - ✅ Default role and warehouse set in your Snowflake user profile
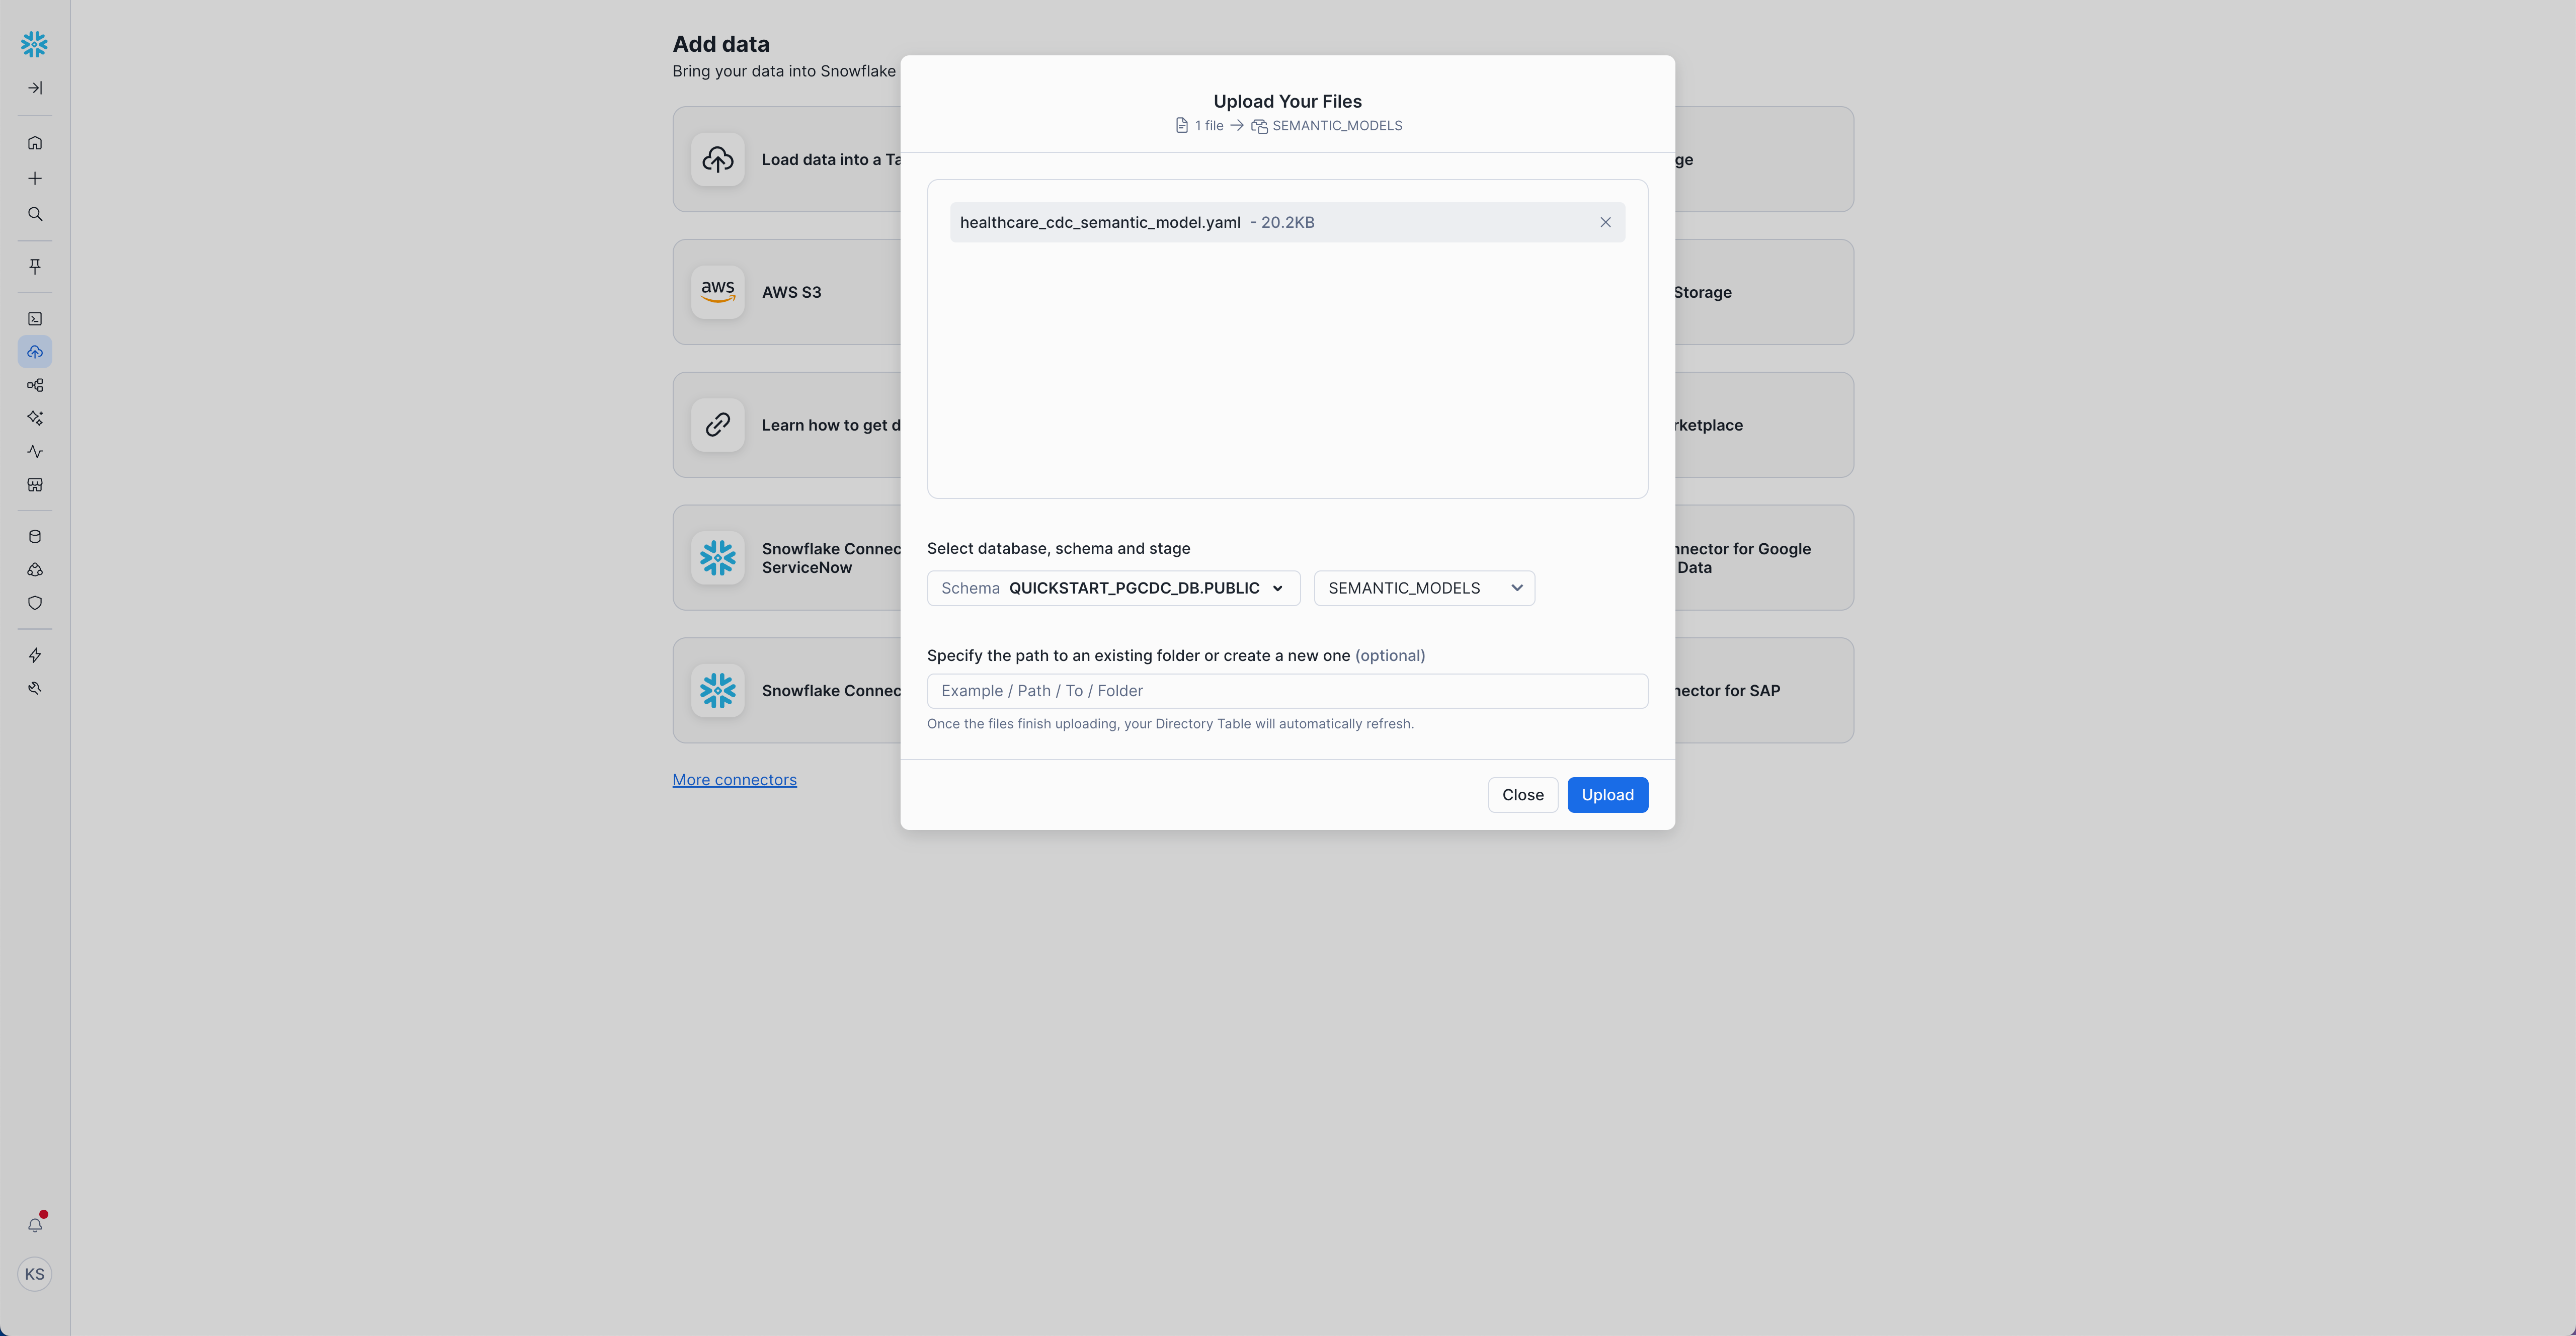
Upload Semantic Model
The semantic model defines your healthcare schema for the AI agent. It includes table definitions, relationships, and CDC metadata columns.
Upload the semantic model to the stage using Snowsight:
- Navigate directly to Ingestion –> Add Data: Load files into a Stage
- Select the database, schema, and stage:
- Database:
QUICKSTART_PGCDC_DB - Schema:
PUBLIC - Stage:
semantic_models
- Database:
- Click + Files and select
healthcare_cdc_semantic_model.yamlfrom thesemantic-models/directory in your cloned repository - Click Upload
Or use Snowflake CLI:
snow stage put semantic-models/healthcare_cdc_semantic_model.yaml @semantic_models \
  --database QUICKSTART_PGCDC_DB \
  --schema PUBLIC \
  --role QUICKSTART_ROLE \
  --overwrite
Verify the upload via Database Explorer
Create the Agent
Access Agent Creation Interface
- Sign in to Snowsight
- Switch to
QUICKSTART_ROLEusing the role selector in the top-right corner - Navigate directly to Agents: Create Snowflake Intelligence Agent
- Select "Create agent"
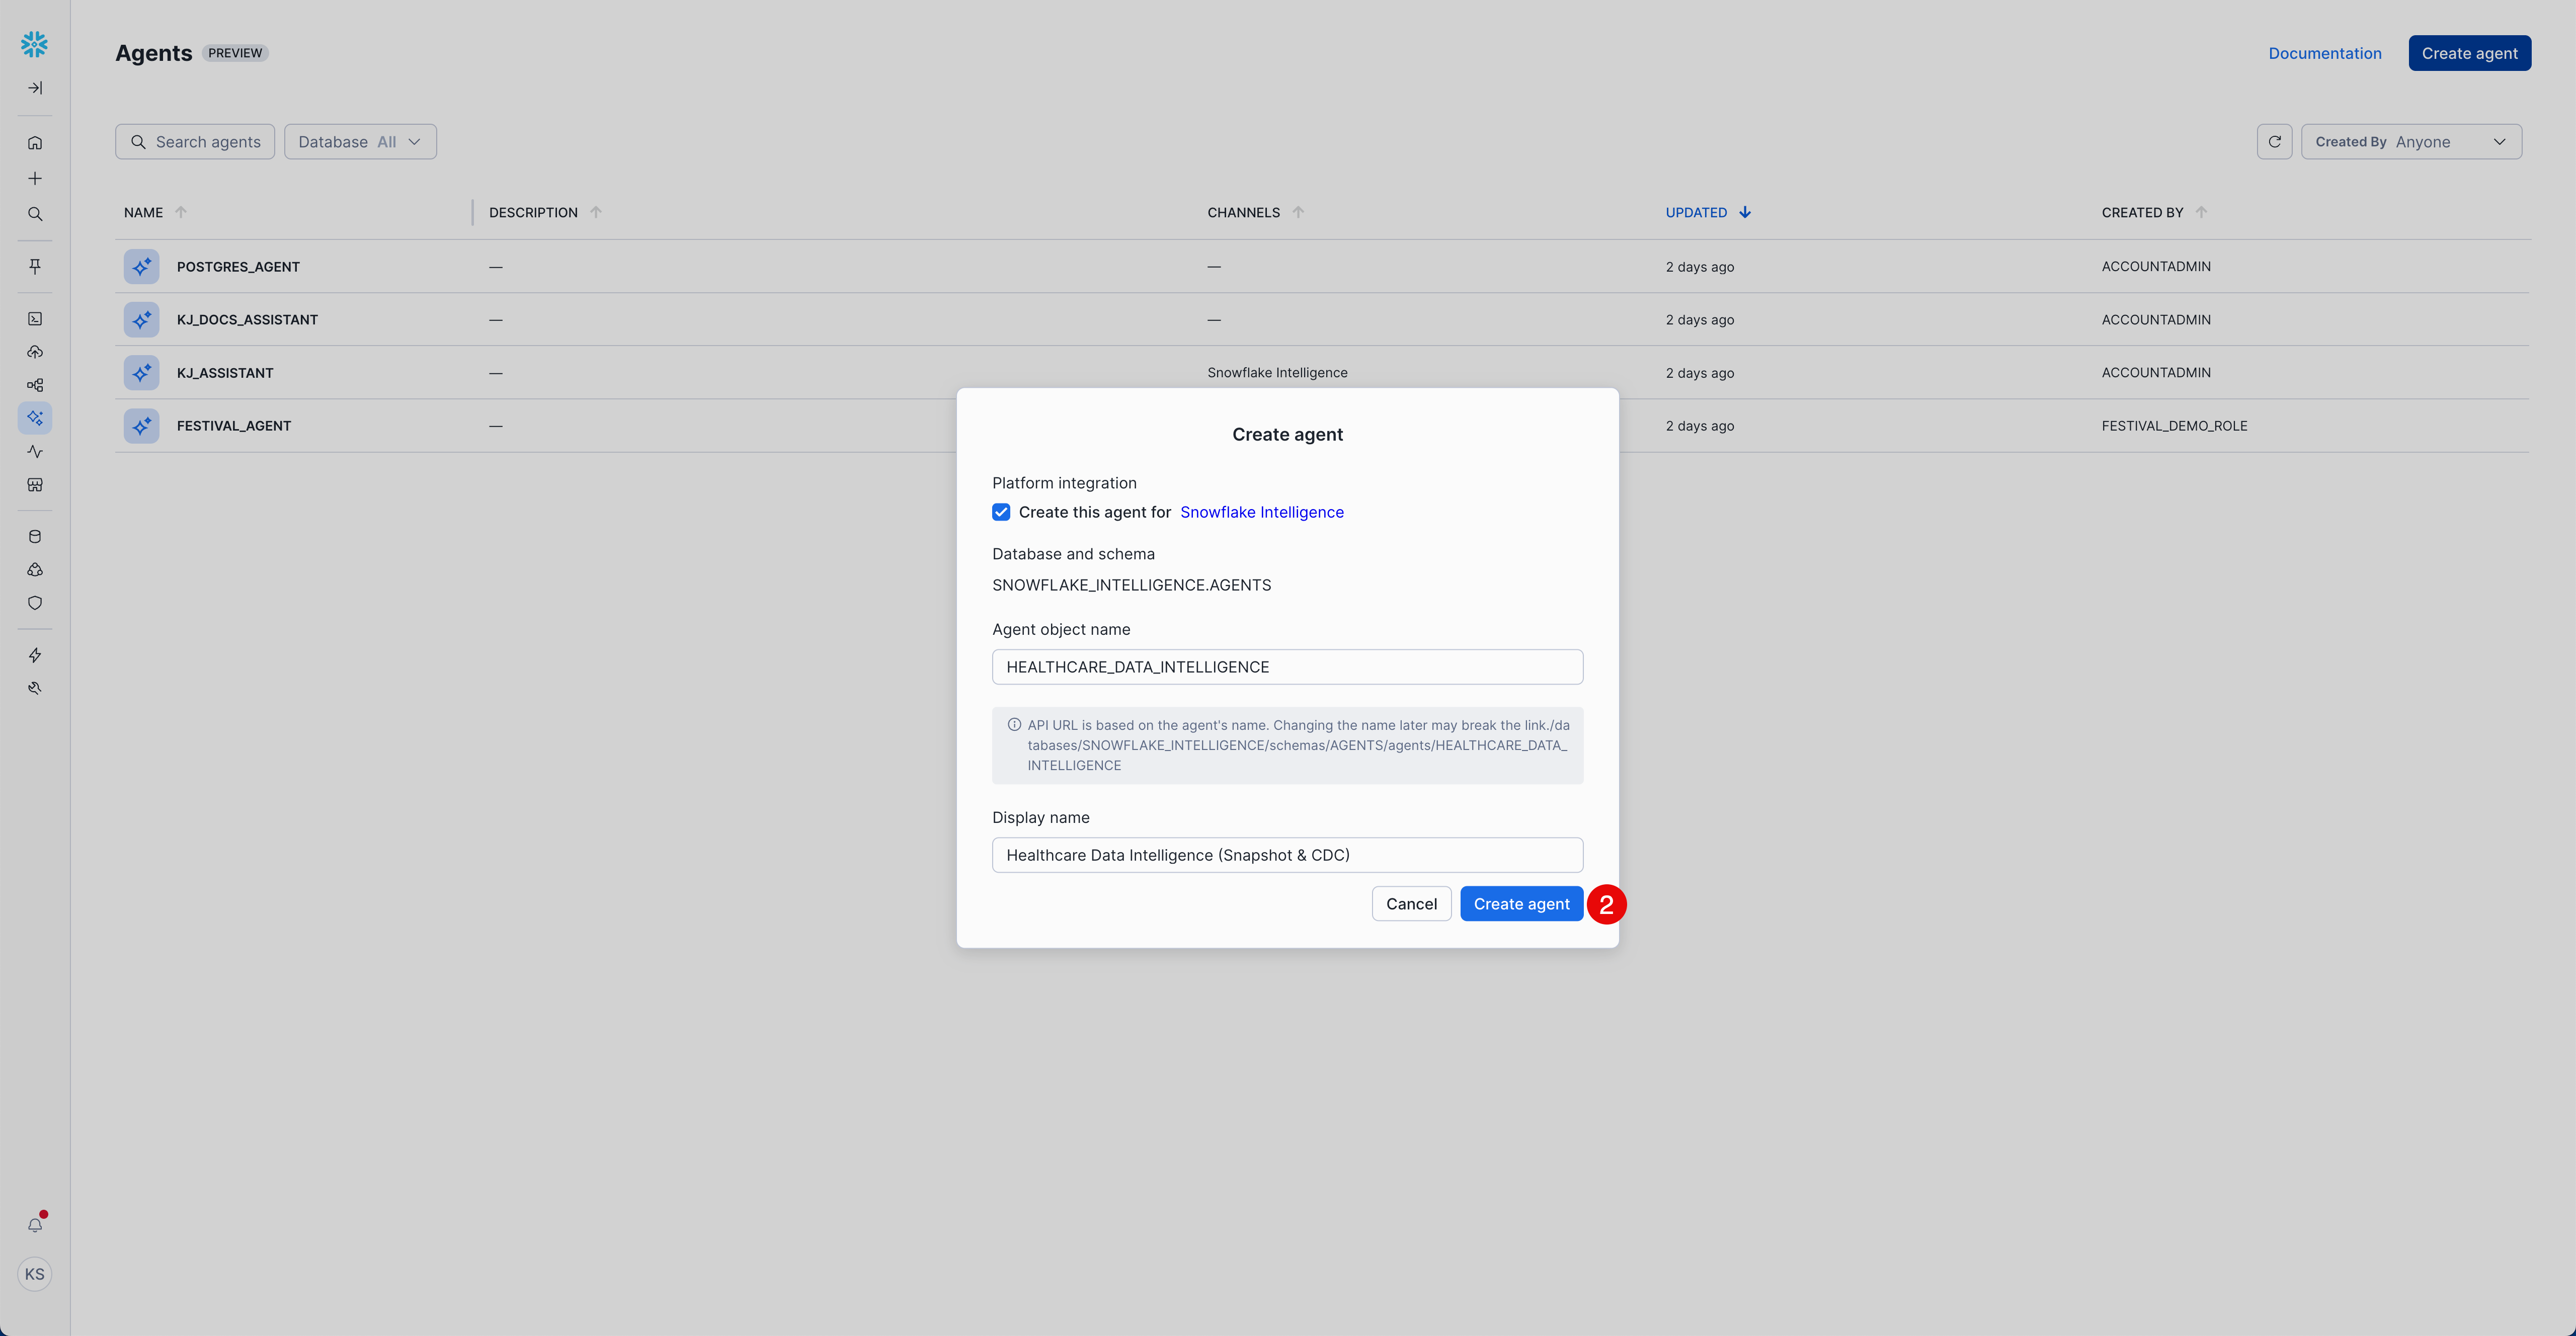
Platform Integration:
- ☑️ Select "Create this agent for Snowflake Intelligence"
Agent Details:
- Agent object name:
HEALTHCARE_DATA_INTELLIGENCE - Display name:
Healthcare Data Intelligence (Snapshot & CDC)
Configure Agent Basics
After creating the agent, configure its details:
- Click on the agent name (
HEALTHCARE_DATA_INTELLIGENCE) in the agent list to open it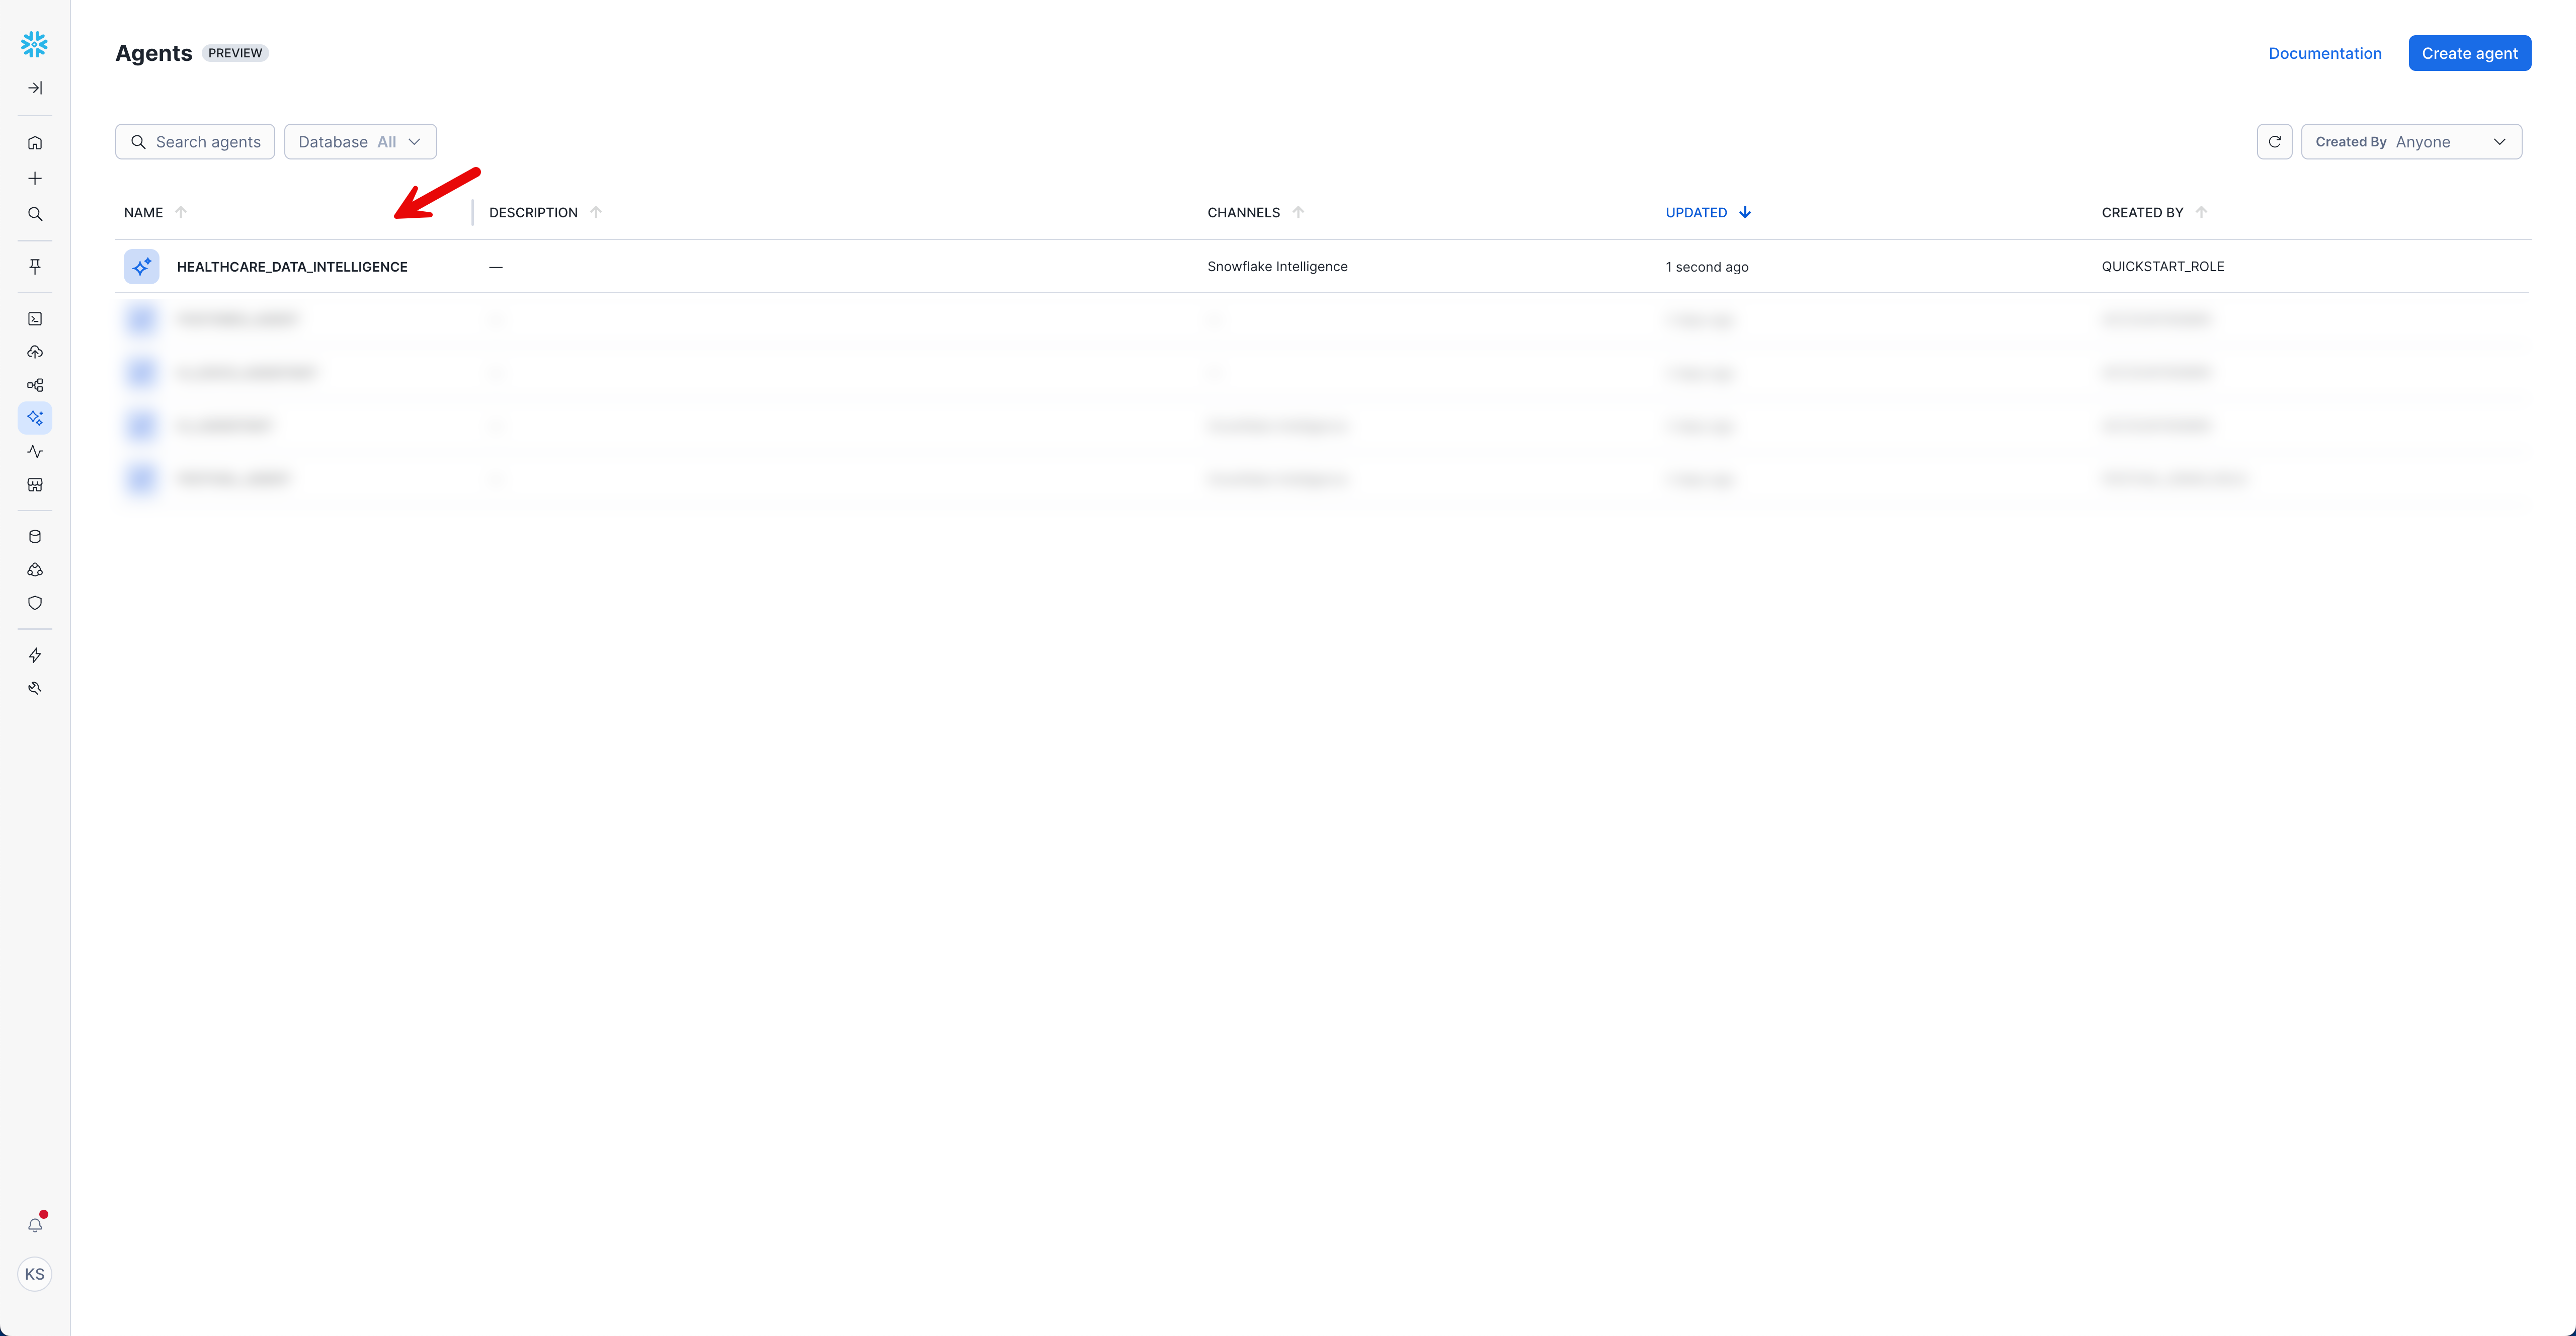
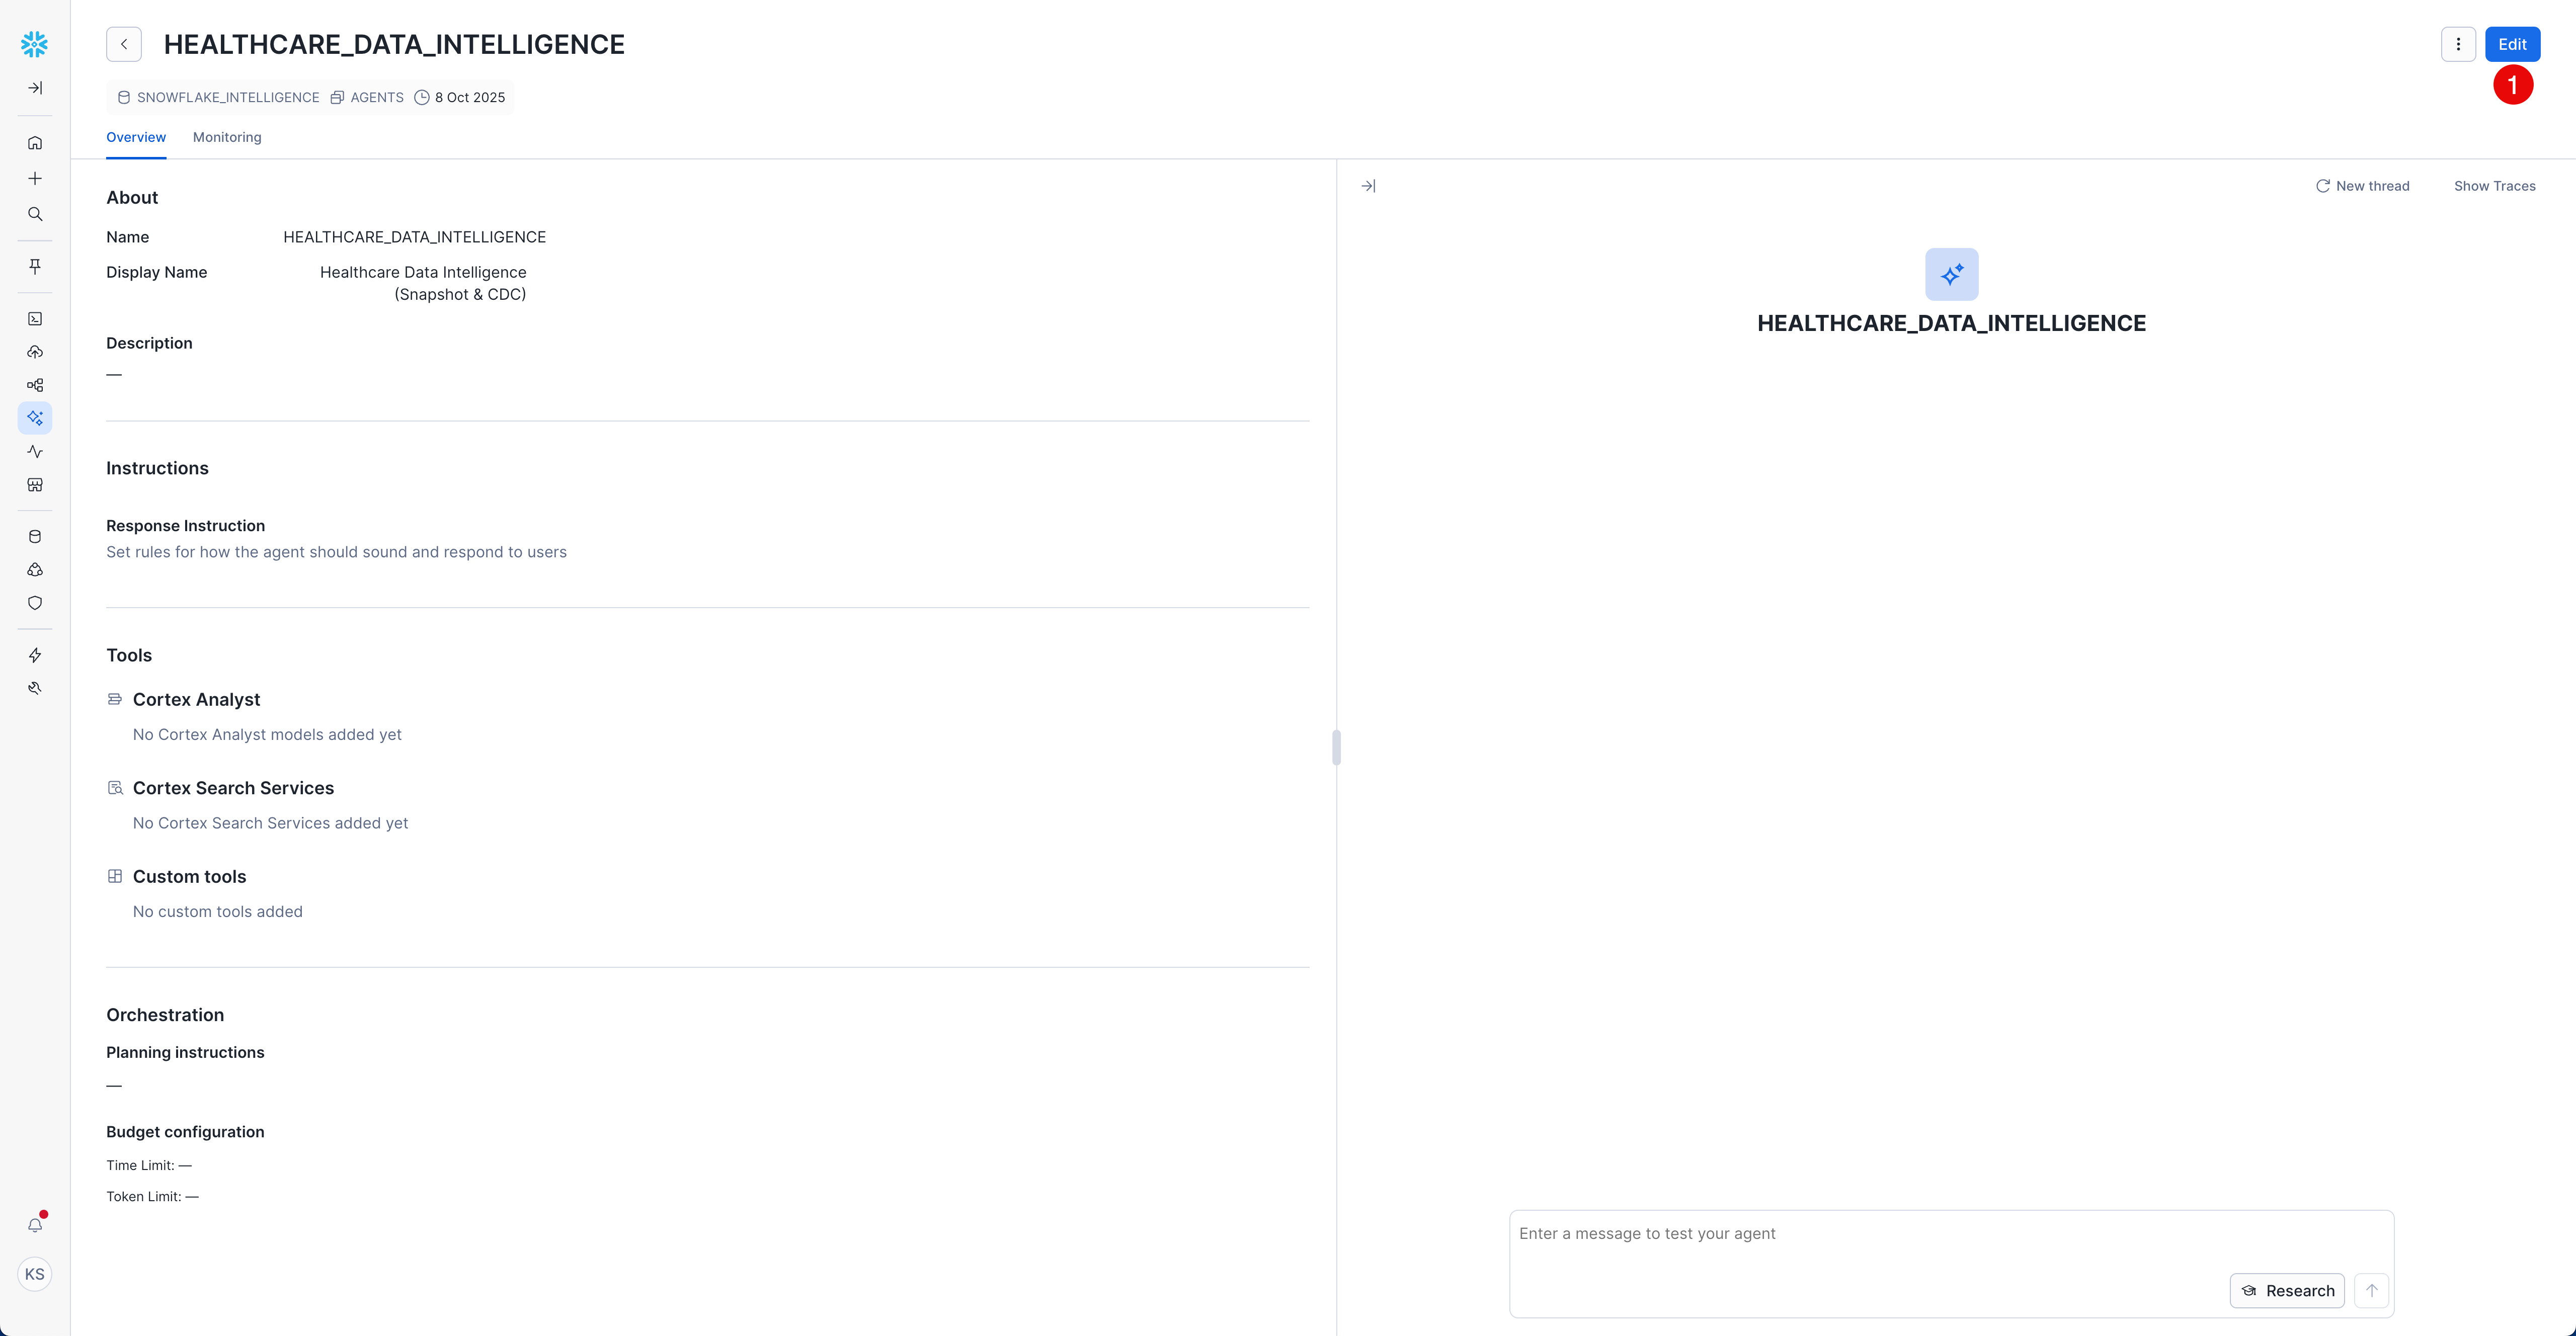
- Click "Edit" button to start editing the agent configuration
Now configure the agent basics in the "About" section:
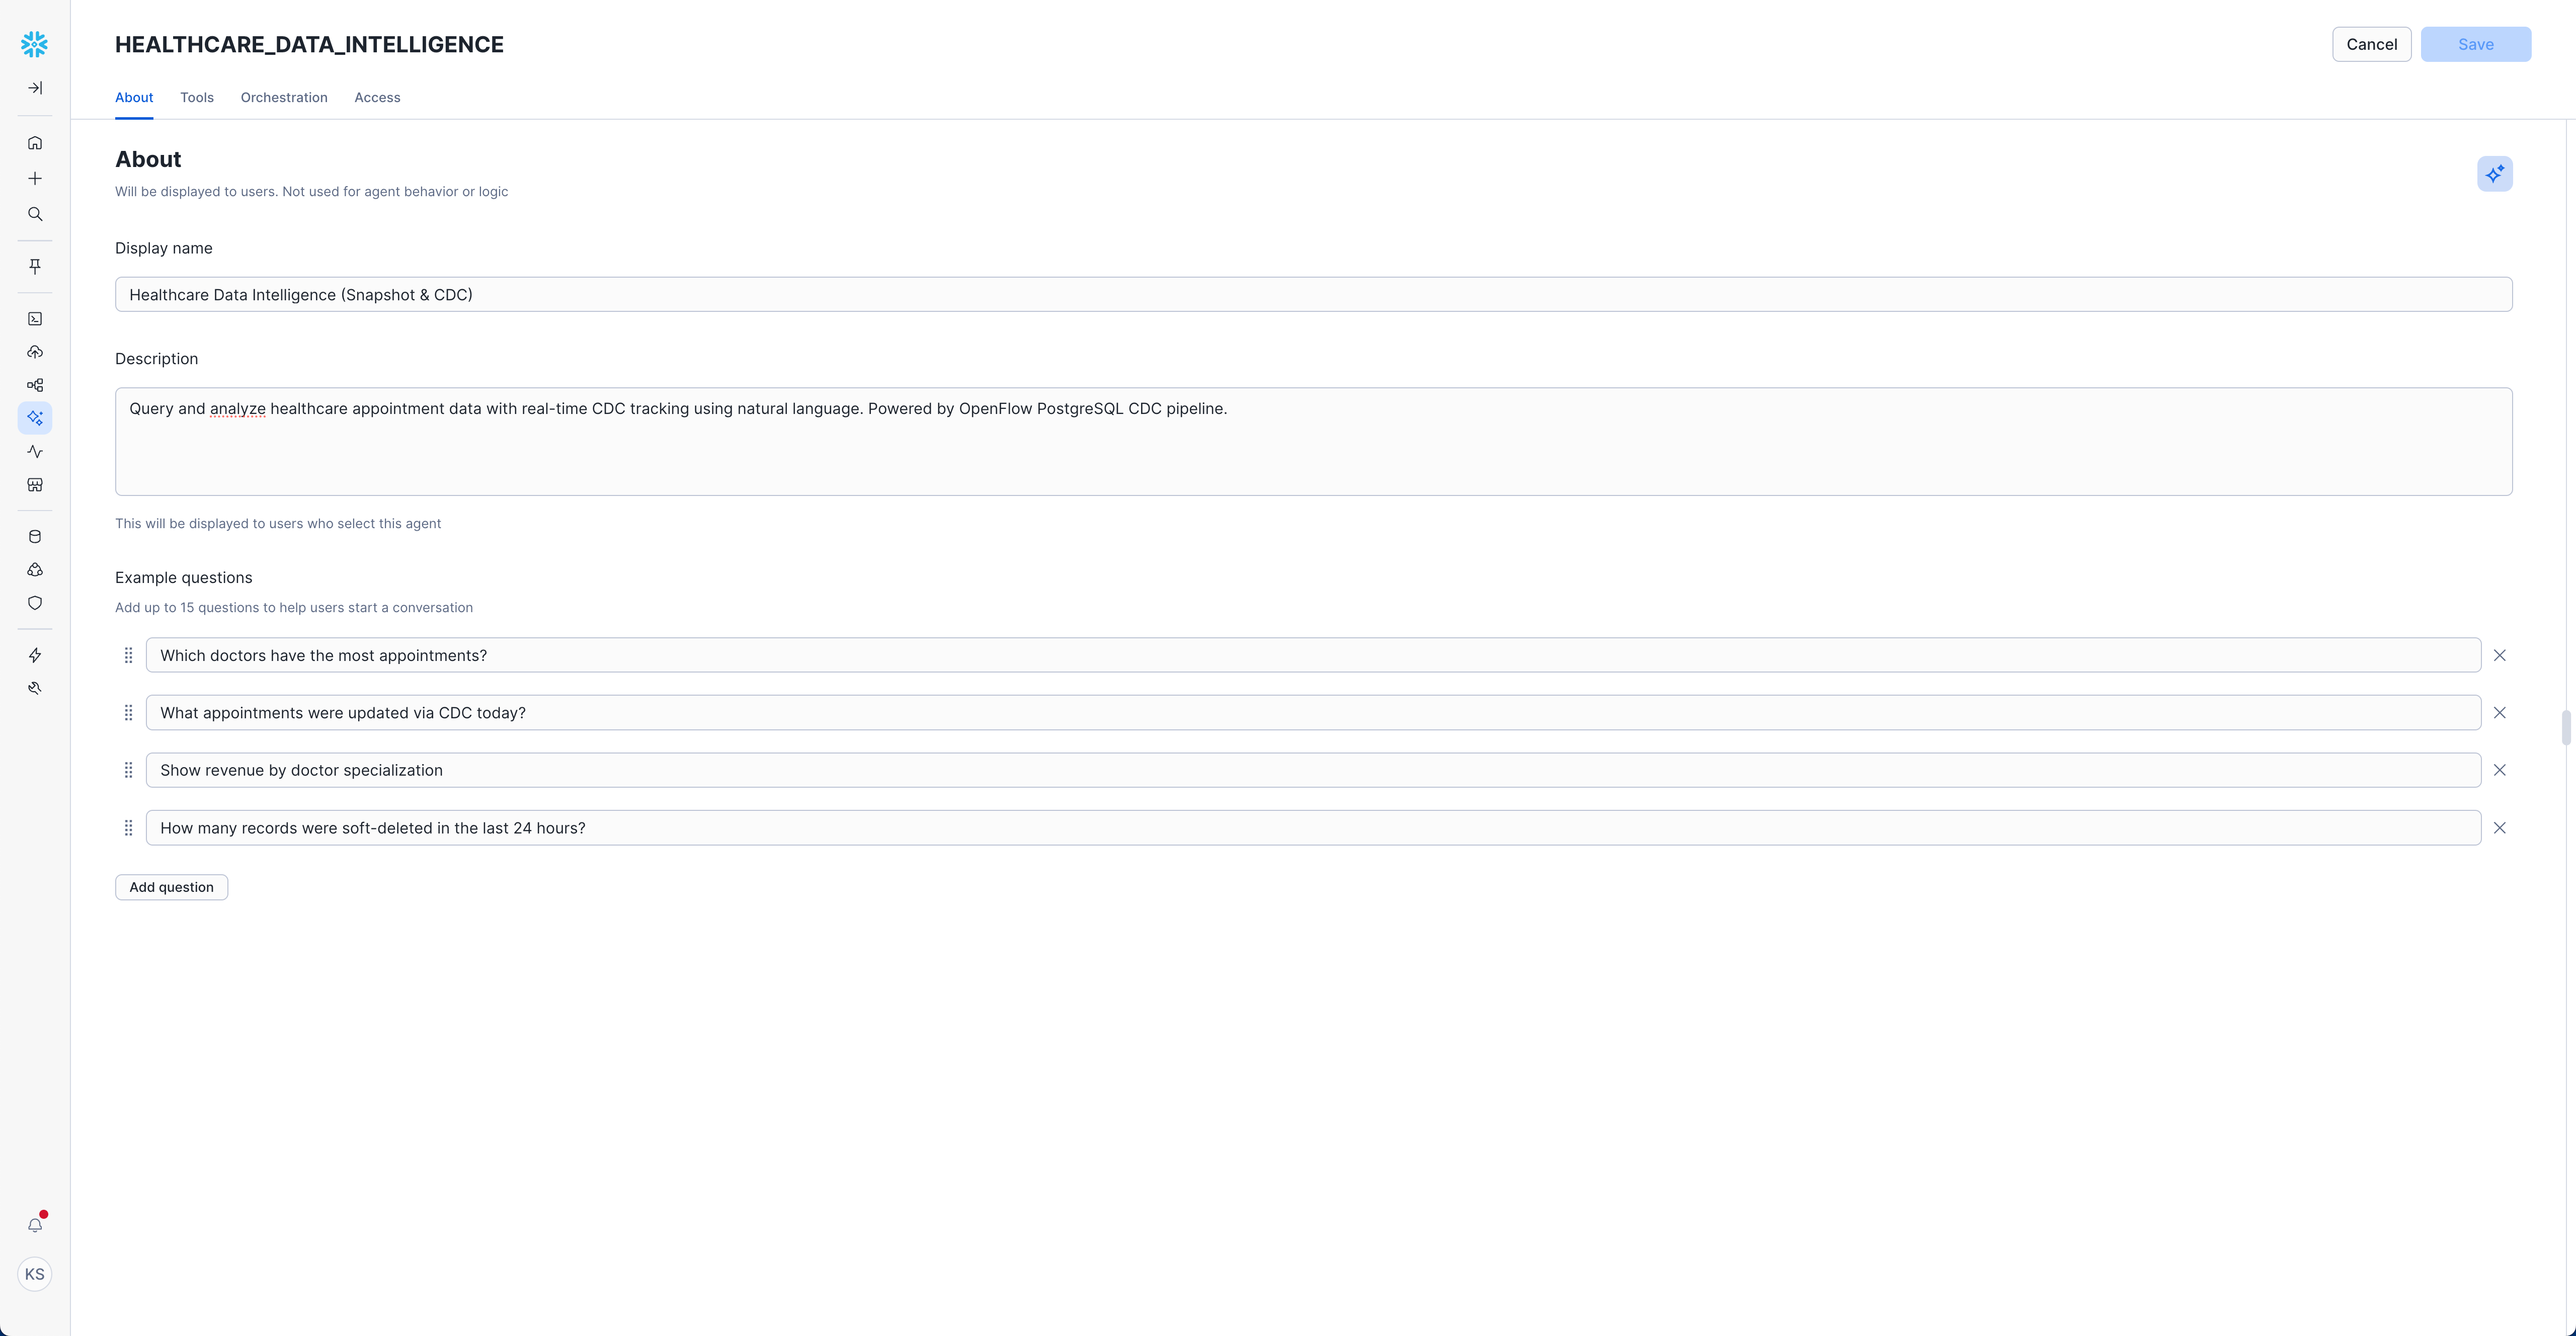
- Description:
Query and analyze healthcare appointment data with real-time CDC tracking using natural language. Powered by OpenFlow PostgreSQL CDC pipeline.
Example Questions (Add these to help users get started):
"Show me the appointment status distribution"
"Which doctors have the most appointments?"
"What appointments were updated via CDC today?"
"Show revenue by doctor specialization"
"How many records were soft-deleted in the last 24 hours?"
Configure Agent Tools
Add Semantic Model
- Navigate to "Tools" tab
- Find "Semantic Models" section
- Click "+ Add" button
Configure the Semantic Model:
- Name:
HEALTHCARE_DATA_ANALYTICS - Stage:
@PUBLIC.semantic_models - File:
healthcare_cdc_semantic_model.yaml - Description:
Healthcare appointment management with real-time snapshot and CDC data tracking
Configure Orchestration
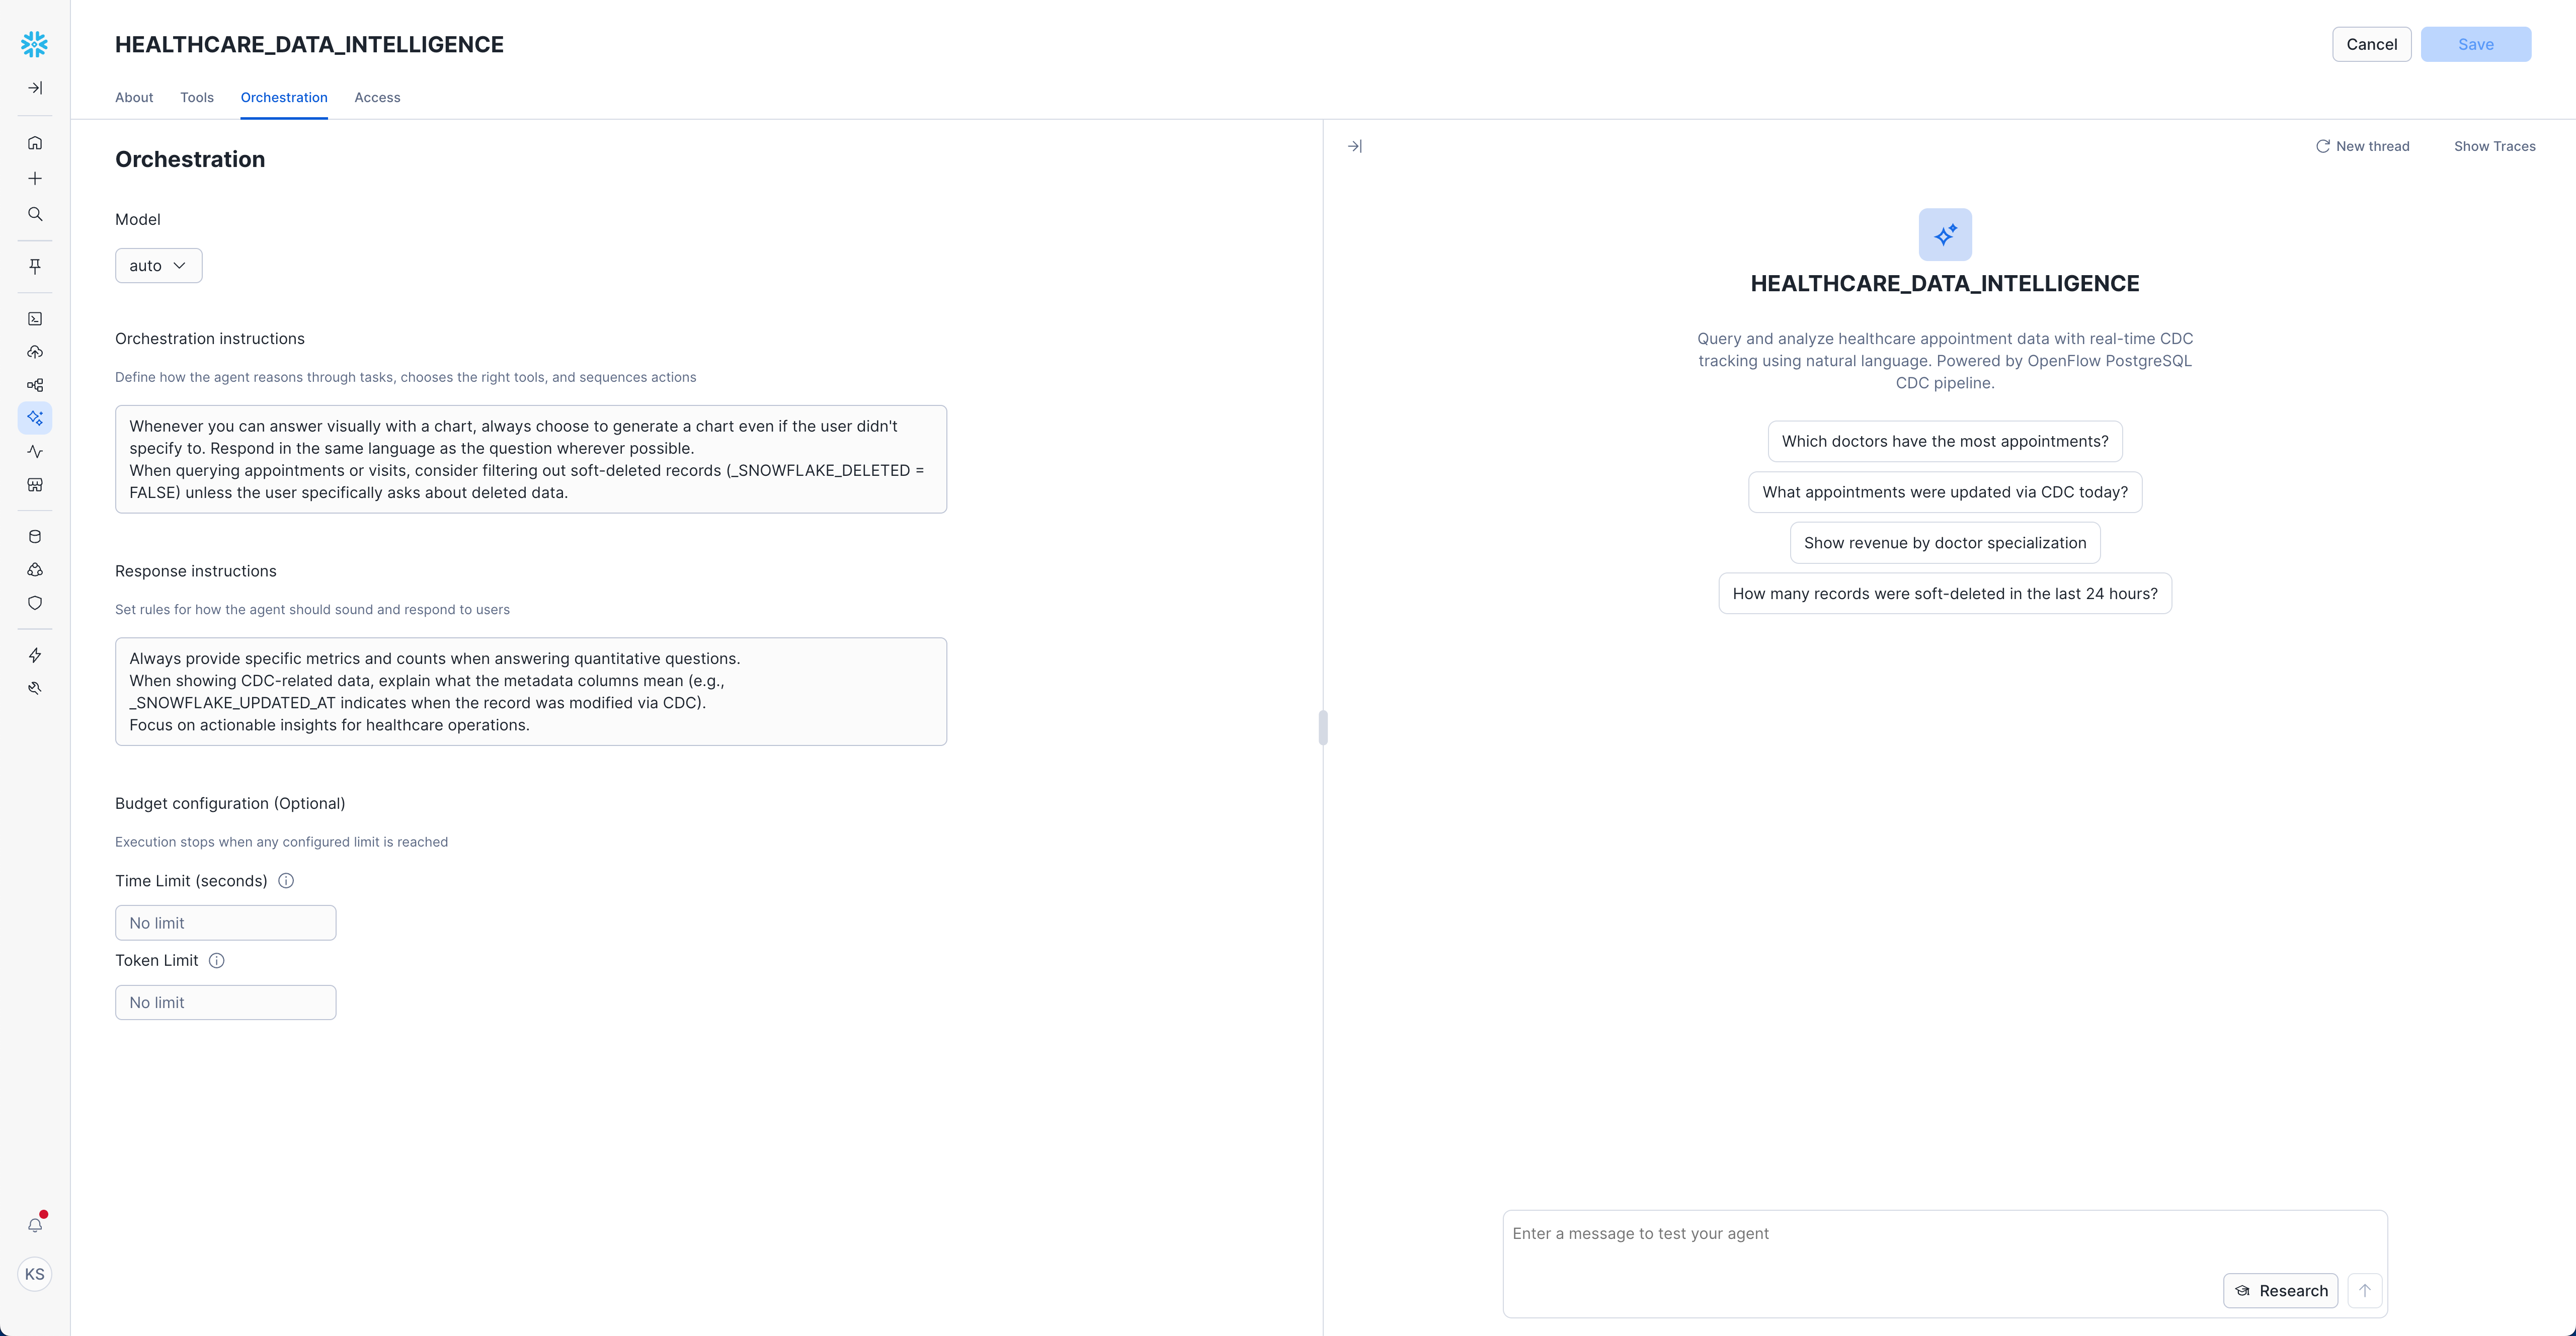
- Navigate to "Orchestration" tab
- Set Model:
auto(recommended - lets Snowflake choose the optimal model)
Orchestration Instructions:
Whenever you can answer visually with a chart, always choose to generate a chart even if the user didn't specify to.
Respond in the same language as the question wherever possible.
When querying appointments or visits, consider filtering out soft-deleted records (_SNOWFLAKE_DELETED = FALSE) unless the user specifically asks about deleted data.
Response Instructions: (Optional)
Always provide specific metrics and counts when answering quantitative questions.
When showing CDC-related data, explain what the metadata columns mean (e.g., _SNOWFLAKE_UPDATED_AT indicates when the record was modified via CDC).
Focus on actionable insights for healthcare operations.
Set Access Controls
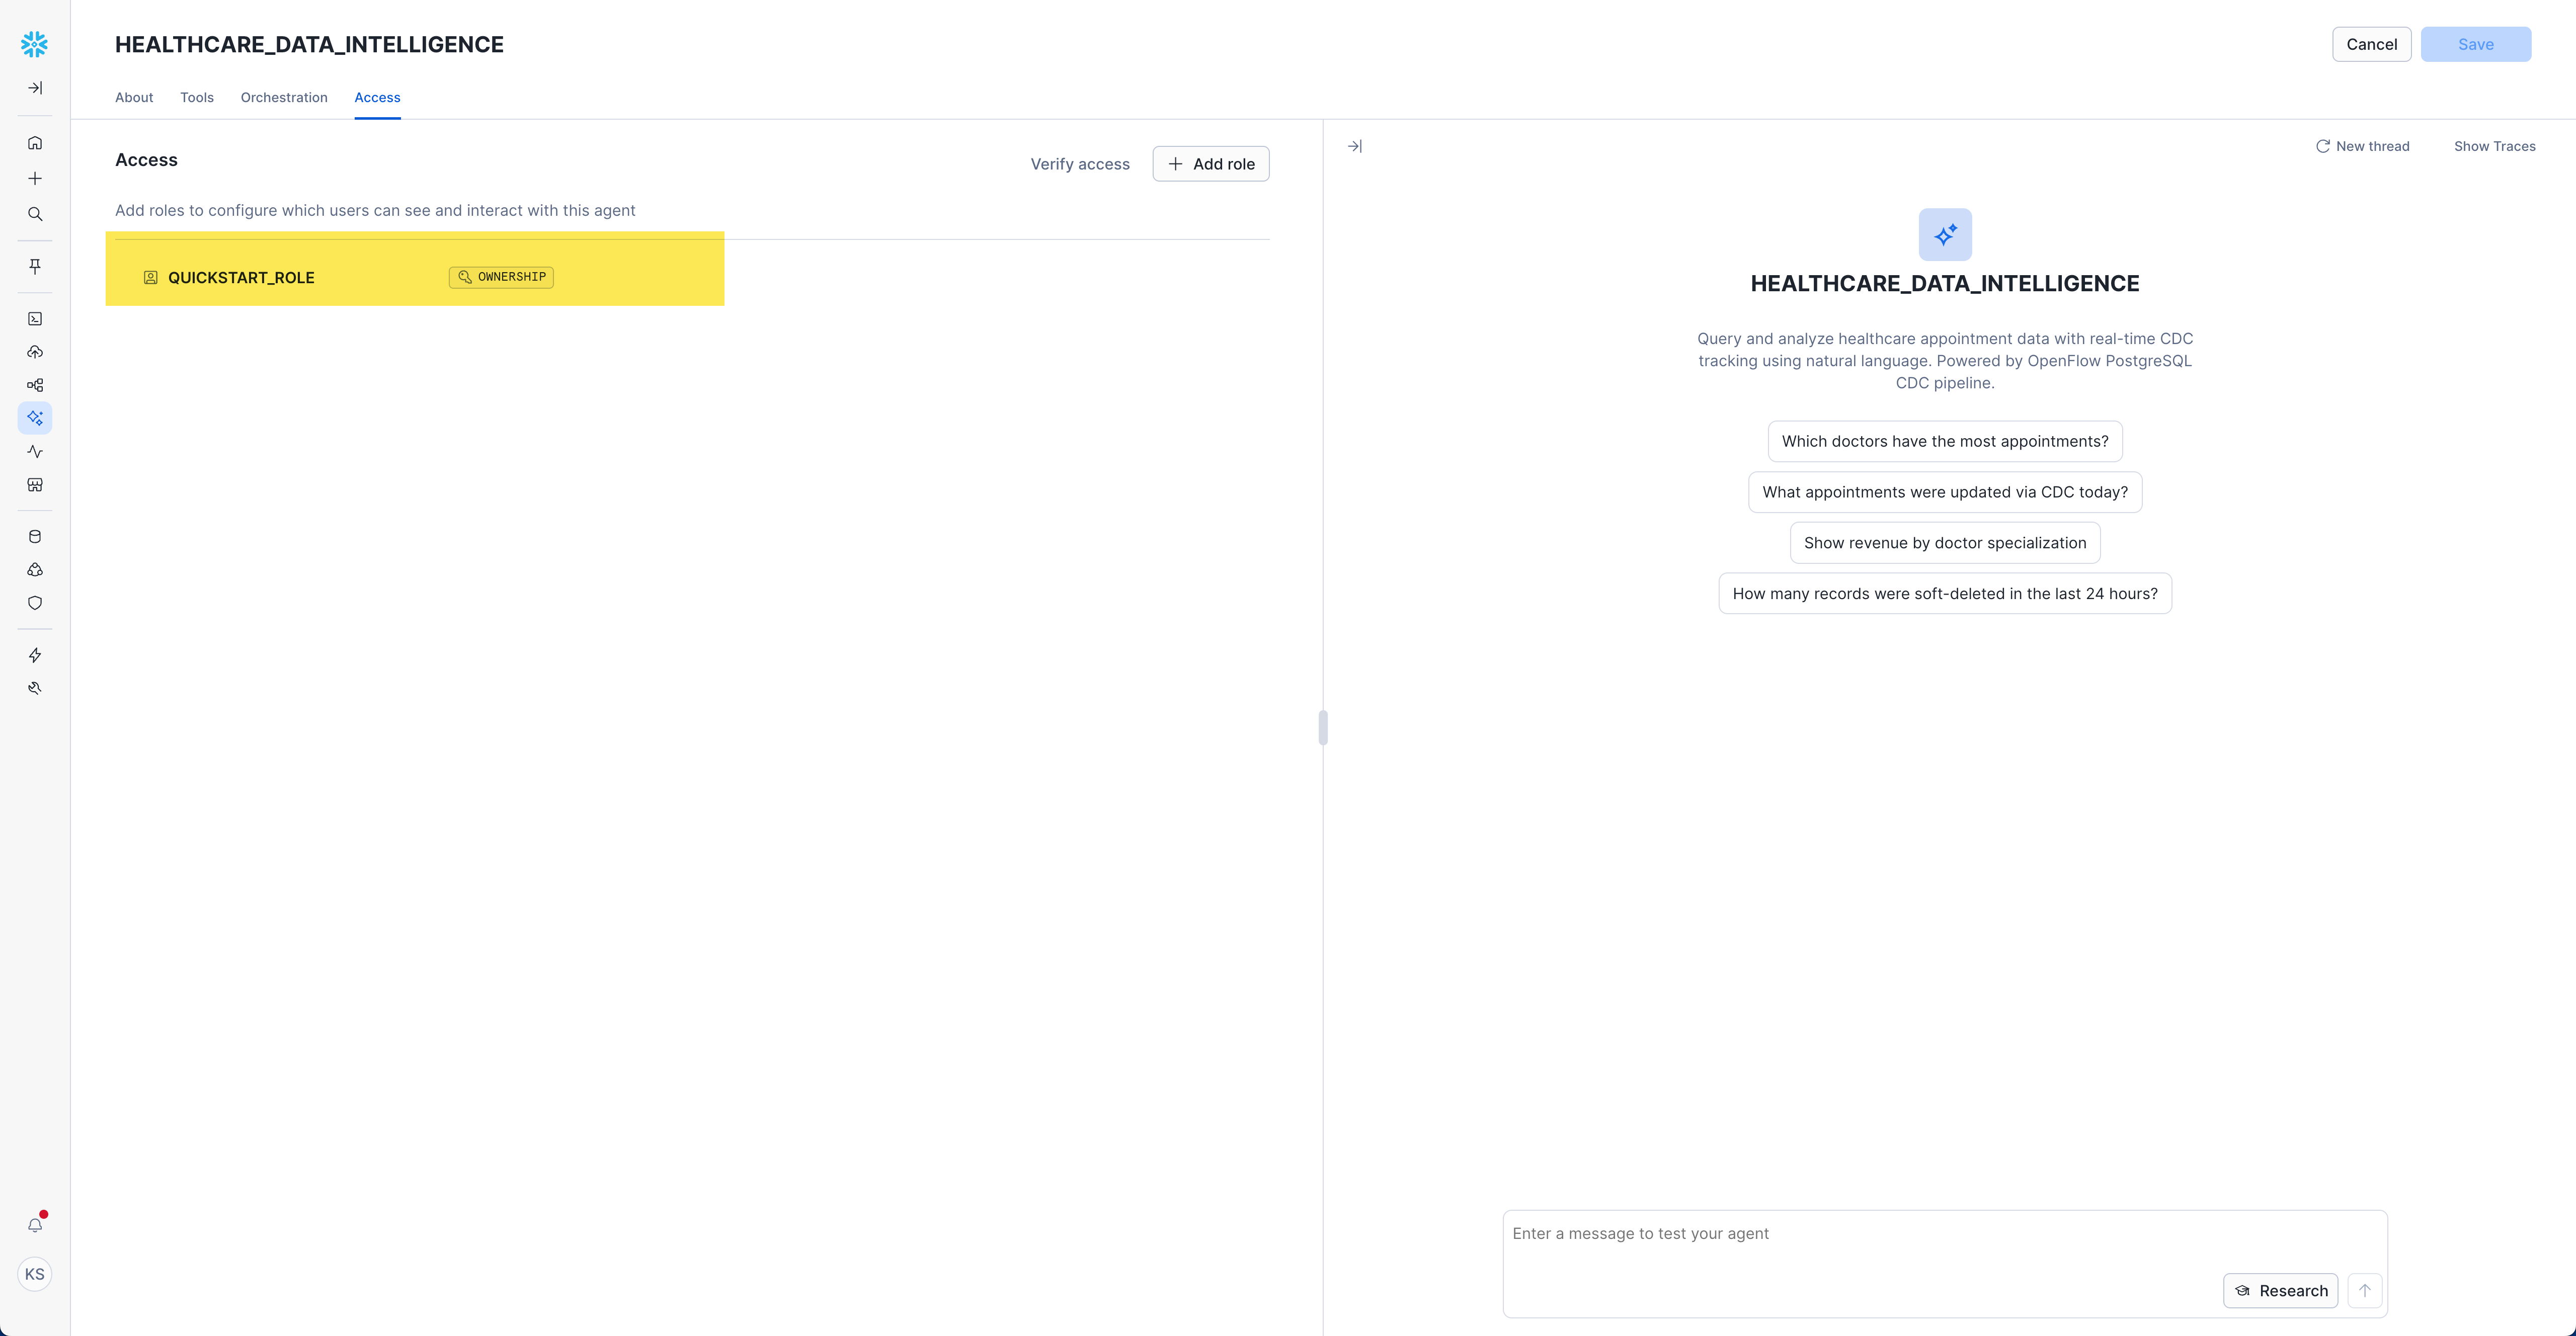
- Navigate to "Access" tab
- Click "Add role"
- Select appropriate roles for your organization
Example Role Configuration:
- Role:
QUICKSTART_ROLE - Permission:
OWNERSHIP
Ask Baseline Questions (Snapshot Data)
Now that your agent is configured, let's ask baseline questions about the snapshot data to establish the initial state.
Getting Started with Queries
- Access Snowflake Intelligence: Open Snowflake Intelligence
- Select your agent
Healthcare Data Intelligence (Snapshot & CDC)from the dropdown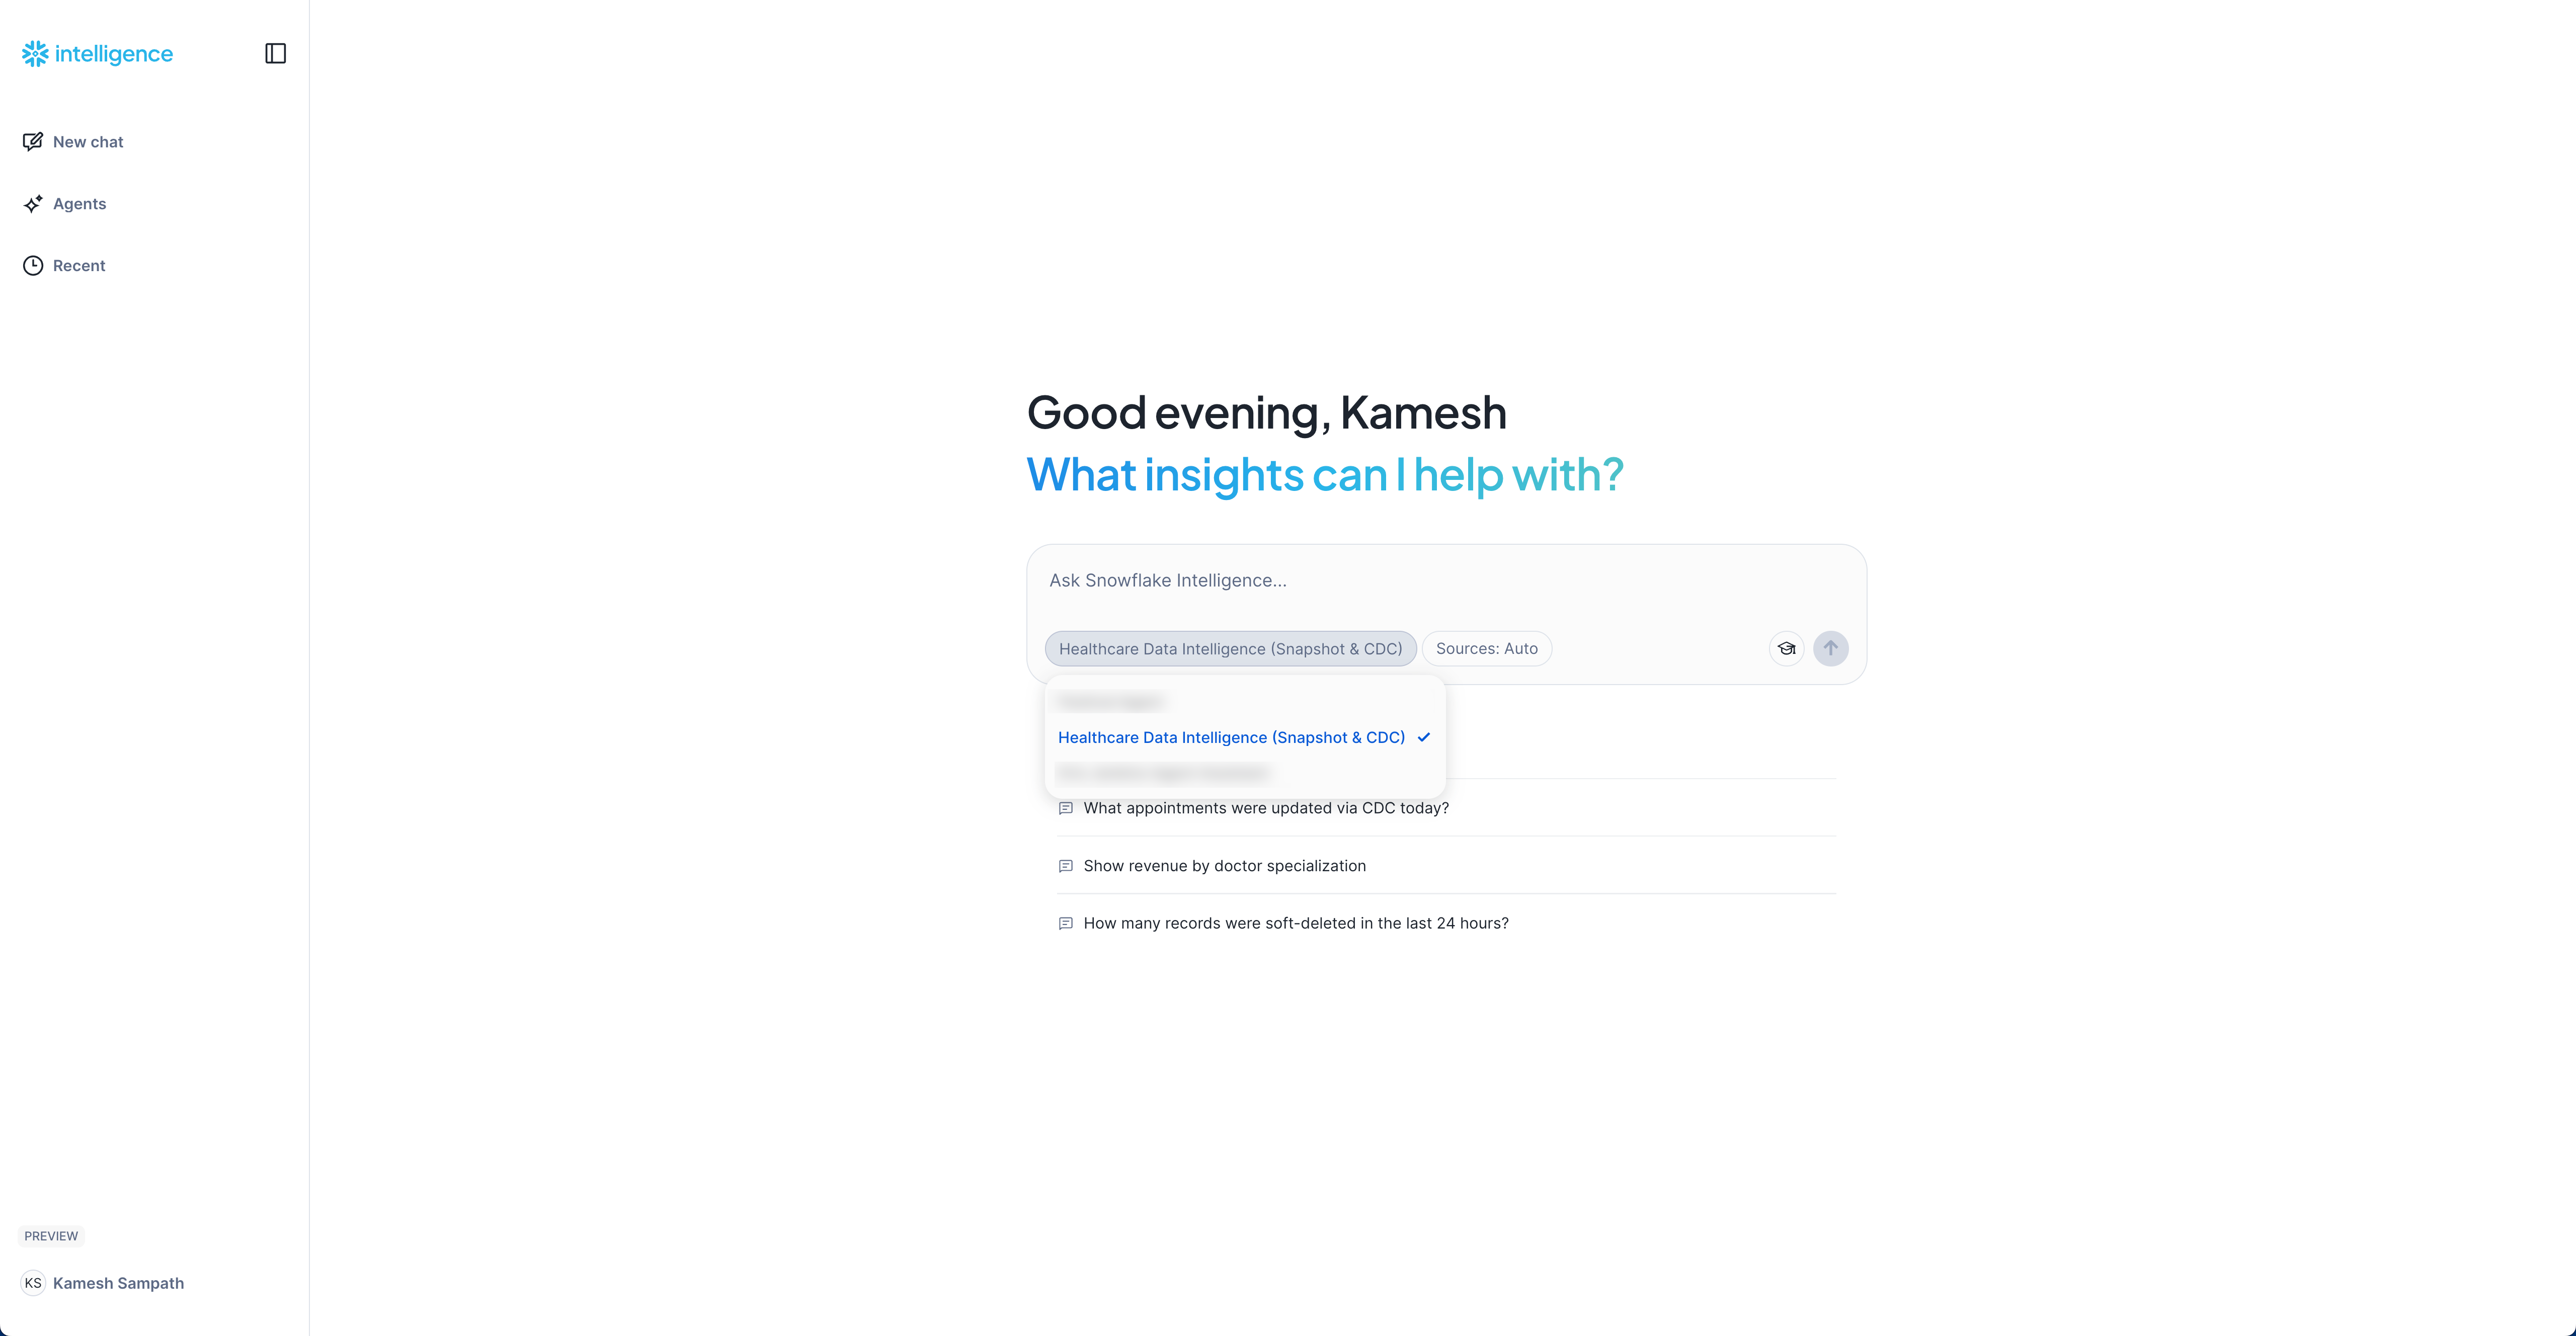
- Set the role and warehouse for the agent to use:
- Role:
QUICKSTART_ROLE - Warehouse:
QUICKSTART_PGCDC_WH
- Role:
- Start with these baseline questions:
Baseline Questions:
"How many total appointments do we have?"
Expected: ~170 appointments from snapshot load
"Show me the appointment status distribution"
Expected: Breakdown showing completed (100), cancelled (40), scheduled (15), no_show (10), confirmed (5)
"Which doctors have the most appointments?"
Expected: List of 10 doctors with appointment counts
"What's the total revenue from all visits?"
Expected: Sum of charges from 100 visits (~$15,000-$20,000)
"Show me appointments by specialization"
Expected: Breakdown by General Practice, Cardiology, Pediatrics, Orthopedics, etc.
"Are there any records with CDC updates yet?"
Expected: "No, all records are from the initial snapshot load. The _Snowflake_UPDATED_AT column is NULL for all records."
Now that the snapshot is loaded, let's generate live CDC events to see real-time replication in action. We'll simulate a busy morning at DemoClinic Healthcare with various database operations.
What CDC Events Will Be Generated
The demo script simulates a busy morning at DemoClinic Healthcare (8:00 AM - 12:45 PM) and will generate the following CDC events:
Event Type | Operation | Count | Description |
INSERT | New Appointments | 10 | - 3 scheduled appointments (8:00 AM) |
INSERT | New Visit Records | 4 | - 2 completed visits (9:30 AM) |
UPDATE | Appointment Status Changes | 20+ | - Scheduled → Confirmed (morning batch) |
DELETE | Removed Appointments | 2 | - Old cancelled appointments deleted (soft delete in Snowflake) |
UPDATE | Doctor Records | 1 | - Doctor availability changed (accepting_new_patients = FALSE) |
Total Impact:
- 170 → 180 appointments (net +10, accounting for 2 deletes)
- 100 → 104 visit records (net +4)
- 20+ appointment status transitions captured
- 2 soft-deleted records (visible with
_SNOWFLAKE_DELETED = TRUE) - 1 doctor record update
Run CDC Demo Script
The easiest way to generate CDC events is to run the provided SQL script on your PostgreSQL database.
Option 1: Using psql Command Line
If you have the environment variables set from earlier, run:
psql -f sql/3.live_appointments.sql
Or with explicit connection:
psql -h YOUR_POSTGRES_HOST \
     -p 5432 \
     -U postgres \
     -d postgres \
     -f sql/3.live_appointments.sql
Option 2: Copy and Paste in pgAdmin or PostgreSQL Client
- Open the script: 3.live_appointments.sql
- Copy the entire contents
- Paste into your PostgreSQL client (pgAdmin, DBeaver, etc.)
- Execute the script
The script will:
- Run for approximately 5 minutes (with strategic pauses)
- Display progress messages with timestamps (8:00 AM → 12:45 PM simulation)
- Wait 60 seconds after major operations to align with CDC sync intervals
- Show a summary of changes at the end
Expected Output
You should see output like this:
🕐 8:00 AM - New appointment requests coming in...
✅ 3 new appointments scheduled

🕐 8:15 AM - Front desk confirming today's appointments...
✅ Today's appointments confirmed

🕐 8:30 AM - Patients checking in for their appointments...
✅ 4 patients checked in

...

═══════════════════════════════════════════════════════════
📊 CDC Demo Summary - Changes Generated
═══════════════════════════════════════════════════════════

 activity                            | count
-------------------------------------+-------
 New appointments created            |    10
 Appointments updated (status changes)|    20
 New visit records created           |     4
 Doctor records updated              |     1

✅ All CDC events have been generated!
Verify Changes in Snowflake
While the script is running (or immediately after), switch to Snowflake to see the changes appear in real-time.
Check Updated Row Counts
Run this query to see the increased record counts:
USE ROLE QUICKSTART_ROLE;
USE DATABASE QUICKSTART_PGCDC_DB;
USE SCHEMA "healthcare";
USE WAREHOUSE QUICKSTART_PGCDC_WH;

SELECT 'patients' as table_name, COUNT(*) as record_count FROM "patients"
UNION ALL
SELECT 'doctors', COUNT(*) FROM "doctors"
UNION ALL
SELECT 'appointments', COUNT(*) FROM "appointments"
UNION ALL
SELECT 'visits', COUNT(*) FROM "visits"
ORDER BY table_name;
Expected output (compare to snapshot baseline of 170 appointments, 100 visits):
+----------------+--------------+
| TABLE_NAME     | RECORD_COUNT |
+----------------+--------------+
| appointments   |          180 | -- +10 new appointments (net: 12 inserts - 2 deletes)
| doctors        |           10 | -- unchanged
| patients       |          100 | -- unchanged
| visits         |          104 | -- +4 new visit records
+----------------+--------------+
Verify CDC Metadata Shows Updates
Check the CDC metadata timestamps to see snapshot vs updated records:
SELECT
    COUNT(*) as total_records,
    SUM(CASE WHEN _SNOWFLAKE_DELETED THEN 1 ELSE 0 END) as deleted_records,
    COUNT(DISTINCT _SNOWFLAKE_INSERTED_AT) as distinct_insert_times,
    COUNT(DISTINCT _SNOWFLAKE_UPDATED_AT) as distinct_update_times
FROM "appointments";
Expected output:
+----------------+-----------------+-----------------------+-----------------------+
| TOTAL_RECORDS  | DELETED_RECORDS | DISTINCT_INSERT_TIMES | DISTINCT_UPDATE_TIMES |
+----------------+-----------------+-----------------------+-----------------------+
|           180  |               2 |                    2+ |                    2+ |
+----------------+-----------------+-----------------------+-----------------------+
This shows:
- 180 total appointments (170 original + 10 new from CDC)
- 2 deleted appointments (soft deleted with
_SNOWFLAKE_DELETED = TRUE) - 2+ distinct insert times (snapshot load + CDC inserts)
- 2+ distinct update times (various CDC updates)
To see the distribution of when records were inserted:
SELECT
    DATE_TRUNC('minute', _SNOWFLAKE_INSERTED_AT) as insert_minute,
    COUNT(*) as records_inserted
FROM "appointments"
GROUP BY insert_minute
ORDER BY insert_minute;
This will show you the snapshot load followed by CDC inserts happening later.
Query the Journal Tables
Snowflake Openflow creates journal tables that track all CDC events. These tables are created dynamically as CDC events occur for each table, following the naming pattern:
Based on the CDC events generated by the live appointments script, you'll see these journal tables appear in order:
- First:
appointments_JOURNAL_1759908563_1- Created when appointment status changes occur - Second:
visits_JOURNAL_1759908563_1- Created when new visit records are added - Third:
doctors_JOURNAL_1759908563_1- Created when doctor availability is updated
Query recent CDC events for appointments:
-- View recent CDC events for appointments
-- Replace the timestamp with your actual journal table name
SELECT
    SEEN_AT as event_time,
    EVENT_TYPE,
    "PRIMARY_KEY__appointment_id" as appointment_id,
    "PAYLOAD__patient_id" as patient_id,
    "PAYLOAD__doctor_id" as doctor_id,
    "PAYLOAD__status" as status,
    "PAYLOAD__reason_for_visit" as reason_for_visit,
    "PAYLOAD__appointment_date" as appointment_date
FROM QUICKSTART_PGCDC_DB."healthcare"."appointments_JOURNAL_1759908563_1"
WHERE SEEN_AT >= DATEADD(minute, -10, CURRENT_TIMESTAMP)
ORDER BY SEEN_AT DESC
LIMIT 20;
To find your actual journal table names:
SHOW TABLES LIKE '%_JOURNAL_%' IN SCHEMA QUICKSTART_PGCDC_DB."healthcare";
This shows the complete audit trail of all changes captured by CDC!
View Deleted Records
Query appointments that were deleted (soft delete):
SELECT
    "appointment_id",
    "patient_id",
    "status",
    "appointment_date",
    "reason_for_visit",
    _SNOWFLAKE_INSERTED_AT,
    _SNOWFLAKE_UPDATED_AT,
    _SNOWFLAKE_DELETED
FROM "appointments"
WHERE _SNOWFLAKE_DELETED = TRUE;
Expected output (the exact appointment_id and patient_id values will be consistent across runs due to deterministic ORDER BY appointment_id):
+-----------------+------------+------------+------------------+-----------------------------+---------------------------+---------------------------+----------------------+
| APPOINTMENT_ID  | PATIENT_ID | STATUS     | APPOINTMENT_DATE | REASON_FOR_VISIT            | _SNOWFLAKE_INSERTED_AT    | _SNOWFLAKE_UPDATED_AT     | _SNOWFLAKE_DELETED   |
+-----------------+------------+------------+------------------+-----------------------------+---------------------------+---------------------------+----------------------+
|             123 |         45 | cancelled  | 2024-08-15       | Annual physical examination | 2025-10-08 10:15:33.000   | 2025-10-08 15:30:22.000   | TRUE                 |
|             156 |         78 | cancelled  | 2024-09-01       | Routine checkup             | 2025-10-08 10:15:40.000   | 2025-10-08 15:30:22.000   | TRUE                 |
+-----------------+------------+------------+------------------+-----------------------------+---------------------------+---------------------------+----------------------+
Compare Before and After Status Distribution
Re-run the status distribution query to see the changes:
SELECT
    "status",
    COUNT(*) as count,
    ROUND(COUNT(*) * 100.0 / SUM(COUNT(*)) OVER (), 2) as percentage
FROM "appointments"
WHERE NOT _SNOWFLAKE_DELETED  -- Exclude deleted records
GROUP BY "status"
ORDER BY count DESC;
Key Changes from Baseline:
The CDC script will create these changes:
- completed: Increases by +4 (new completed visits)
- scheduled: Increases by +5 (new future appointments)
- no_show: Increases by +1 (missed appointment)
- confirmed: Decreases as some move to other statuses
- in_progress: New status with +2 (active visits)
- Total active records: 170 → 180 (+10 net, accounting for 2 soft deletes)
The exact counts and percentages will vary based on your baseline snapshot data (which uses RANDOM() for initial status assignment), but you should see the relative changes described above.
Return to Snowflake Intelligence (Ask CDC Questions)
Now that CDC events have been processed, return to your Snowflake Intelligence agent and ask CDC-specific questions to see the changes!
- Access Snowflake Intelligence: Open Snowflake Intelligence
- Select your agent
HEALTHCARE_DATA_INTELLIGENCEfrom the dropdown - Refresh the agent cache by clicking the refresh button or typing a new question (this ensures the agent fetches the latest CDC data)
- Ask these CDC-focused questions:
CDC Monitoring Questions
Track Recent Changes:
"How many appointments were updated via CDC in the last hour?"
Count of records with _SNOWFLAKE_UPDATED_AT in the last hour (typically 10-30 records depending on timing)
"Show me all appointments that were modified today via CDC"
Table with appointment details and _SNOWFLAKE_UPDATED_AT timestamps
"Which appointments were soft-deleted?"
2 cancelled appointments that were removed (where _SNOWFLAKE_DELETED = TRUE)
Compare Before and After
Compare to Your Baseline:
"What's the new appointment status distribution?"
Expected: Updated counts showing more completed appointments than the baseline
"How many new visit records were created today?"
Expected: Visit count increase from baseline of 100 to 110 visits
"Show me appointments that changed from scheduled to completed"
Expected: Appointments with status transitions during the CDC demo
Operational Analytics
Real-time Operations:
"Which doctors completed the most visits today?"
Expected: Doctor rankings with today's completed visit counts
"What's today's total revenue from visits?"
Expected: Sum of charges from visits created today (~$2,000-$3,000 from new visits)
"Show me all urgent appointments added today"
Expected: Walk-in appointments with urgent status added during CDC demo
CDC Audit Trail
Track Changes:
"Show me appointments with status changes in the last 2 hours?"
Expected: Appointments with _SNOWFLAKE_UPDATED_AT in last 2 hours
"How many total records have been modified via CDC?"
Expected: Count where _SNOWFLAKE_UPDATED_AT IS NOT NULL (~30 records)
"What percentage of appointments were updated via incremental vs snapshot only?"
Expected: Ratio showing ~85% snapshot, ~15% CDC-modified
Advanced CDC Questions
Change Patterns:
"Show me the timeline of appointment status changes today"
Expected: Time-series of status transitions with timestamps
"Which patient had the most appointment updates?"
Expected: Patient with multiple appointment modifications during the demo
"Compare snapshot-only vs CDC-updated appointment counts"
Expected: Breakdown showing 170 snapshot, 30 CDC-modified
Business Insights
Operational Metrics:
"What's the cancellation rate for today's appointments?"
Expected: Percentage of cancelled appointments
"Show revenue by doctor for visits completed in the last hour"
Expected: Recent revenue attribution from new visits
"How many appointments need follow-up visits?"
Expected: Count from visits where follow_up_required = TRUE
Alternative: SQL Queries
If you prefer SQL over natural language, you can also use the comprehensive analytics script with 20+ pre-built queries:
📋 Analytics Script: 4.analytics_queries.sql
Example SQL Queries:
1. CDC Change Volume:
SELECT
    'appointments' as table_name,
    COUNT(*) as total_records,
    SUM(CASE WHEN _SNOWFLAKE_UPDATED_AT IS NULL THEN 1 ELSE 0 END) as snapshot_only,
    SUM(CASE WHEN _SNOWFLAKE_UPDATED_AT IS NOT NULL THEN 1 ELSE 0 END) as updated_via_cdc,
    SUM(CASE WHEN _SNOWFLAKE_DELETED THEN 1 ELSE 0 END) as soft_deleted
FROM "appointments";
2. Recent CDC Events:
SELECT
    "appointment_id",
    "patient_id",
    "status",
    "appointment_date",
    _SNOWFLAKE_UPDATED_AT,
    _SNOWFLAKE_DELETED
FROM "appointments"
WHERE _SNOWFLAKE_UPDATED_AT >= DATEADD(hour, -24, CURRENT_TIMESTAMP)
ORDER BY _SNOWFLAKE_UPDATED_AT DESC;
3. Doctor Productivity with CDC Data:
SELECT
    d."first_name" || ' ' || d."last_name" as doctor_name,
    d."specialization",
    COUNT(a."appointment_id") as total_appointments,
    SUM(CASE WHEN a."status" = 'completed' THEN 1 ELSE 0 END) as completed
FROM "doctors" d
LEFT JOIN "appointments" a ON d."doctor_id" = a."doctor_id"
WHERE NOT a._SNOWFLAKE_DELETED OR a._SNOWFLAKE_DELETED IS NULL
GROUP BY d."doctor_id", d."first_name", d."last_name", d."specialization"
ORDER BY completed DESC;
When you're done with the quickstart, follow these steps to clean up all resources. This prevents unnecessary compute costs and removes test data from your environment.
Step 1: Stop the PostgreSQL Connector (Optional)
If you want to temporarily pause CDC replication without deleting any configuration:
- Navigate to your Openflow runtime canvas
- Right-click on the PostgreSQL processor group
- Select Stop to halt CDC replication
- Wait for the connector to fully stop (status indicator turns red)
Step 2: Delete Openflow Runtime (Permanent)
Deleting the Openflow runtime will automatically stop all services and connectors, and clean up the container infrastructure.
For Dedicated Runtime (Created for This Quickstart)
If you created a dedicated Openflow runtime for this quickstart:
Via Snowsight:
- Navigate to Work with data → Ingestion → Openflow
- Go to Runtimes tab
- Find your runtime (e.g.,
quickstart_pgcdc_runtime) - Click on the runtime and select Delete
- Confirm deletion
- Wait for the runtime to be fully removed (this may take a few minutes)
For Shared Runtime (From Companion Quickstart)
Instead, stop the PostgreSQL connector and its related services:
- Navigate to Work with data → Ingestion → Openflow
- Select your runtime and open the canvas
- Right-click on the PostgreSQL processor group
- Select Stop to halt the connector
- Right-click on each related service (NiFi processors, controller services)
- Select Stop or Disable to stop all CDC-related services
- Wait for all components to fully stop (status indicators turn red/gray)
Step 3: Clean Up PostgreSQL
Remove the CDC configuration and test database from PostgreSQL.
Terminate Active Replication Slots
Connect to your PostgreSQL database and run these queries:
-- View replication slots
SELECT slot_name, slot_type, active, restart_lsn
FROM pg_replication_slots
WHERE database = 'postgres';
Since you stopped the connector in previous steps, the slot will show active = false. Drop the inactive slot:
-- Drop inactive replication slot(s)
SELECT pg_drop_replication_slot(slot_name)
FROM pg_replication_slots
WHERE database = 'postgres'
  AND NOT active;
Drop the Publication
Remove the CDC publication:
-- Drop the publication for healthcare tables
DROP PUBLICATION IF EXISTS healthcare_cdc_publication;
Drop the Healthcare Schema (Optional)
If you want to completely remove the test data:
-- Drop the healthcare schema and all its objects
DROP SCHEMA IF EXISTS healthcare CASCADE;

-- Verify cleanup
SELECT schema_name
FROM information_schema.schemata
WHERE schema_name = 'healthcare';
Expected output: Empty result set (0 rows), confirming the healthcare schema has been removed.
Step 4: Drop Snowflake Intelligence Agent
Remove the AI agent and its associated database:
-- Use ACCOUNTADMIN role (required for agent operations)
USE ROLE ACCOUNTADMIN;

-- Drop the Snowflake Intelligence agent
DROP AGENT IF EXISTS snowflake_intelligence.agents.HEALTHCARE_DATA_INTELLIGENCE;
Step 5: Drop Snowflake Objects
Remove all Snowflake resources created for this quickstart:
-- Use ACCOUNTADMIN role for cleanup
USE ROLE ACCOUNTADMIN;

-- Drop the main database (includes healthcare schema and all tables)
DROP DATABASE IF EXISTS QUICKSTART_PGCDC_DB CASCADE;

-- Drop the warehouse
DROP WAREHOUSE IF EXISTS QUICKSTART_PGCDC_WH;

-- Drop the external access integration
DROP INTEGRATION IF EXISTS quickstart_pgcdc_access;

-- Drop the role
DROP ROLE IF EXISTS QUICKSTART_ROLE;
Verify Cleanup
Confirm all objects are removed:
-- Check for remaining objects
SHOW DATABASES LIKE 'QUICKSTART_PGCDC_DB';
SHOW DATABASES LIKE 'snowflake_intelligence';
SHOW WAREHOUSES LIKE 'QUICKSTART_PGCDC_WH';
SHOW INTEGRATIONS LIKE 'quickstart_pgcdc_access';
SHOW ROLES LIKE 'QUICKSTART_ROLE';
Expected output: Empty result sets for all queries.
Step 6: Remove Local Files (Optional)
If you cloned the quickstart repository locally and no longer need it:
# Navigate to parent directory
cd ..

# Remove the quickstart directory
rm -rf openflow-postgresql-cdc-demo

# Verify removal
ls -la | grep openflow-postgresql-cdc-demo
Cleanup Complete
All resources have been removed. You can verify by:
- ✅ Checking Snowflake compute usage (warehouse should not be running)
- ✅ Confirming no active PostgreSQL replication slots
- ✅ Verifying no Openflow services consuming compute credits
Congratulations! You've successfully built a real-time CDC pipeline from PostgreSQL to Snowflake using Openflow.
What You Learned
- How to configure PostgreSQL logical replication for CDC
- How to set up Snowflake Intelligence with semantic models for natural language queries
- How to configure Openflow PostgreSQL connector for CDC
- How to capture both snapshot and incremental changes
- How to analyze real-time data and CDC metadata with AI-powered insights
- How to use natural language to explore CDC changes
Related Resources
Openflow Documentation:
- Openflow Overview
- PostgreSQL CDC Connector
- MySQL CDC Connector
- SQL Server CDC Connector
- Manage Openflow
- Monitor Openflow
Snowflake Intelligence:
PostgreSQL Resources:
Snowflake Platform:
Feedback: Please provide feedback on this quickstart via GitHub Issues