Demo development is crucial for businesses to showcase their AI capabilities and win new customers. Through rapid prototyping and professional presentation tools, businesses can transform weeks of development into minutes of setup, dramatically accelerating sales cycles and proof-of-concept delivery.
In this Quickstart, we will build a comprehensive demo development platform called "Cortex AI Demo Framework". This demonstrates how to use Snowflake Cortex AI functions to create synthetic data, build interactive analytics, deploy search capabilities, and generate complete demonstration environments.
This Quickstart showcases the complete Cortex AI Demo Framework with:
- 6-application integrated demo platform with Synthetic Data Generator, Structured Tables, SQL to YAML Converter, Snow Demo, YAML Wizard, and Snow Viz
- AI-powered data generation using all Cortex functions
- Advanced semantic search and automated model creation
- Cortex Search Service for intelligent data discovery
- Cortex Analyst integration for natural language queries
- Production-ready applications with professional UI/UX
What You Will Build
- Complete 6-application integrated demo platform
- AI-powered synthetic data generation system using Cortex functions
- Advanced semantic modeling and search capabilities
- Professional demo orchestration and configuration tools
- Interactive dashboard creation wizard with database introspection
- Advanced dashboard renderer with multiple visualization types
- Interactive Cortex Search Service for semantic discovery
- Production-ready Streamlit applications with advanced visualizations
- Reusable framework for rapid demo creation across any industry
What You Will Learn
- How to set up a production demo development pipeline with Snowflake
- How to use Snowflake Notebooks for complex AI demo workflows
- How to implement all Cortex AI functions (SENTIMENT, EXTRACT_ANSWER, COMPLETE)
- How to build scalable demo platforms with synthetic data
- How to create automated semantic models and search services
- How to deploy interactive Streamlit applications in Snowflake
Prerequisites
- Familiarity with Python and SQL
- Familiarity with Streamlit applications
- Go to the Snowflake sign-up page and register for a free account
In this step, you'll create the Snowflake database objects and prepare for framework deployment.
Step 1: Create Database Objects
If you have Workspaces:
- In Snowsight, click
Projects, thenWorkspacesin the left navigation - Click
+ Add newto create a new Workspace - Click
SQL Fileto create a new SQL file - Copy the setup script from setup.sql and paste it into your SQL file, then run it
If you have Worksheets:
- In Snowsight, click
Projects, thenWorksheetsin the left navigation - Click
+in the top-right corner to open a new Worksheet - Copy the setup script from setup.sql and paste it into your worksheet, then run it
The setup script creates:
- Database:
CORTEX_FRAMEWORK_DBwithBRONZE_LAYER,SILVER_LAYER,APPS, andCONFIGSschemas - Role:
CORTEX_FRAMEWORK_DATA_SCIENTISTwith all necessary permissions - Warehouse:
CORTEX_FRAMEWORK_WHfor compute resources - Stages:
FRAMEWORK_DATA_STAGE,SEMANTIC_MODELS, andDEMO_CONFIGSfor file uploads - File Formats:
CSV_FORMAT,YAML_FORMAT, andJSON_FORMATfor data processing - AI Access:
SNOWFLAKE.CORTEX_USERrole for Cortex functions
Step 2: Download Required Framework Files
Download these framework files from the GitHub repository:
File | Purpose | Download Link |
Notebook | Setup notebook for framework deployment | |
Environment File | Conda environment configuration for latest Streamlit | |
Synthetic Data Generator | AI-powered synthetic data creation | |
Structured Tables | Data structuring and transformation | |
SQL to YAML Converter | SQL to YAML configuration converter (generates semantic models) | |
Snow Demo | Demo configuration and runner | |
YAML Wizard | Interactive dashboard configuration creator | |
Snow Viz | Advanced visualization dashboard renderer |
Step 3: Upload Framework Files to Single Stage
- In Snowsight, change your role to
cortex_ai_demo_data_scientist - Navigate to
Catalog→Database Explorer→AI_FRAMEWORK_DB→APPS→Stages
Upload all framework files to the single
AI_FRAMEWORK_APPS
stage:
- Click on
AI_FRAMEWORK_APPSstage, then clickEnable Directory Tableand upload all 7 files:01_ai_framework_synthetic_data_generator.py02_ai_framework_structured_tables.py03_ai_framework_sql_to_yaml_converter.py04_ai_framework_snow_demo.py05_ai_framework_snow_viz_yaml_wizard.py06_ai_framework_snow_viz.pyenvironment.yml
Step 4: Import the Framework Setup Notebook
- Import into Snowflake:
- Navigate to
Projects→Notebooksin Snowsight - Click the down arrow next to
+ Notebookand selectImport .ipynb file - Choose
cortex_ai_demo_framework_setup.ipynbfrom your downloads
- Navigate to
- Configure the notebook settings:
- Role: Select
cortex_ai_demo_data_scientist - Database: Select
AI_FRAMEWORK_DB - Schema: Select
BRONZE_LAYER - Query Warehouse: Select
cortex_ai_demo_wh - Notebook Warehouse: Select
cortex_ai_demo_wh
- Role: Select
- Click
Createto import the notebook
The notebook creates all 6 Streamlit applications using the single stage approach with automatic environment.yml detection for the latest Streamlit version.
Execute the Framework Deployment Workflow
- Go to
Projects→Notebooksin Snowsight - Click on
CORTEX_FRAMEWORK_DEMONotebook to open it - Click
Run allto execute all cells in the notebook at once
What the notebook does:
- Creates sample customer survey data tables
- Processes data with Cortex AI functions (SENTIMENT, EXTRACT_ANSWER, COMPLETE)
- Deploys all 6 Streamlit applications from the uploaded stage files
- Sets up the complete framework for immediate demo creation
The notebook processes sample data and deploys the complete framework application suite.
Access Your Demo Framework
- Navigate to
Projects→Streamlitin Snowsight - You'll see 6 framework applications deployed
The 6 Applications
1. Synthetic Data Generator 🎲 (Always Start Here)
Creates realistic AI-powered datasets using Cortex LLMs. Saves raw JSON to BRONZE_LAYER tables.
2. Structured Tables 🔄
Transforms raw JSON into clean, structured database tables. Outputs analytics-ready data to SILVER_LAYER.
3. SQL to YAML Converter ⚙️
Converts SQL queries into interactive demo configurations for Snow Demo (App 4).
4. Snow Demo 📊
Runs interactive SQL-driven presentations with live visualizations and AI experimentation.
5. YAML Wizard 🧙
Guided dashboard configuration creator. Generates YAML files for Snow Viz (App 6).
6. Snow Viz 📈
Renders advanced interactive dashboards with multi-tab analytics and AI integration.
Application Dependencies
1. SYNTHETIC DATA GENERATOR (START HERE)
   └─ Creates realistic datasets
      │
      ├─ 2. STRUCTURED TABLES
      │  └─ Transforms JSON → SQL tables
      │     │
      │     └─ 5. YAML WIZARD
      │        └─ Generates dashboard configs
      │           │
      │           └─ 6. SNOW VIZ
      │              └─ Renders dashboards
      │
      └─ 3. SQL TO YAML CONVERTER
         └─ Converts queries → demo configs
            │
            └─ 4. SNOW DEMO
               └─ Runs interactive SQL demos
Next: Page 5 shows which apps to use based on your role and goals.
Who Should Use This Framework?
The framework supports 4 different user personas. Find your role below to see which apps you need and in what order.
Persona 1: Full-Stack Data Developer
Who You Are:
- Data engineers building end-to-end pipelines
- Analytics developers creating dashboards
- Technical users who want the complete experience
What You'll Build: A complete analytics pipeline from data generation to interactive dashboards
Apps You'll Use: Synthetic Data Generator → Structured Tables → YAML Wizard → Snow Viz
Time Required: ~25 minutes
Your Workflow:
- Synthetic Data Generator: Generate synthetic data
- Structured Tables: Transform JSON to structured table
- YAML Wizard: Create dashboard configuration
- Snow Viz: View your interactive dashboard
What You'll Get:
- Synthetic dataset with realistic values
- Clean, structured database table
- Interactive dashboard with multiple visualization tabs
Persona 2: SQL Demo Creator / Solutions Architect
Who You Are:
- Solutions architects building customer demos
- Technical evangelists presenting Snowflake capabilities
- Demo creators showcasing SQL + AI features
What You'll Build: Interactive SQL-driven presentations with live query execution and AI experimentation
Apps You'll Use: Synthetic Data Generator → Structured Tables → SQL to YAML Converter → Snow Demo
Time Required: ~30 minutes
Your Workflow:
- Synthetic Data Generator: Generate synthetic data for demos
- Structured Tables: Create structured table
- SQL to YAML Converter: Write SQL queries and convert to demo format
- Snow Demo: Run interactive SQL presentation
What You'll Get:
- Realistic demo dataset
- Multi-step SQL presentation
- Interactive visualizations with live AI experimentation
Persona 3: Data Preparation Specialist
Who You Are:
- Data scientists needing training data
- ML engineers requiring test datasets
- BI developers prototyping dashboards
What You'll Build: Clean, structured datasets for export to external tools (notebooks, ML pipelines, BI tools)
Apps You'll Use: Synthetic Data Generator → Structured Tables
Time Required: ~15 minutes
Your Workflow:
- Synthetic Data Generator: Generate synthetic data
- Structured Tables: Transform to structured table
- Export data via CSV, Python/Snowpark, or direct BI tool connections
What You'll Get:
- Production-ready synthetic datasets
- Validated data quality
- Export-ready structured tables
Persona 4: Dashboard Consumer / Executive
Who You Are:
- Business executives viewing insights
- Managers making data-driven decisions
- Analysts exploring pre-built dashboards
What You'll Do: View and interact with dashboards created by your data team (no setup required)
Apps You'll Use: Snow Viz only (after colleague completes setup)
Time Required: ~5 minutes
Prerequisites: A colleague must first complete Synthetic Data Generator → Structured Tables → YAML Wizard to create the dashboard. Once that's done, you can view and explore it.
Your Workflow:
- Snow Viz: Open app and select dashboard
- Explore tabs with different visualization types
- Use AI Assistant to ask questions in plain English
- Export data to CSV for further analysis
What You Can Do:
- View key metrics and trends
- Ask questions in natural language
- Export results to spreadsheets
Choose Your Path
Ready to get started? Jump to the pages for your persona:
Persona | Apps to Follow | What You'll Build |
Full-Stack Developer | Synthetic Data Generator → Structured Tables → YAML Wizard → Snow Viz | Complete analytics pipeline with dashboards |
SQL Demo Creator | Synthetic Data Generator → Structured Tables → SQL to YAML Converter → Snow Demo | Interactive SQL presentations with AI |
Data Preparation | Synthetic Data Generator → Structured Tables | Clean datasets for ML/BI/external tools |
Dashboard Consumer | Snow Viz only | Explore pre-built dashboards (no setup) |
Or read all app instructions (Pages 6-11) to understand the full framework capabilities.
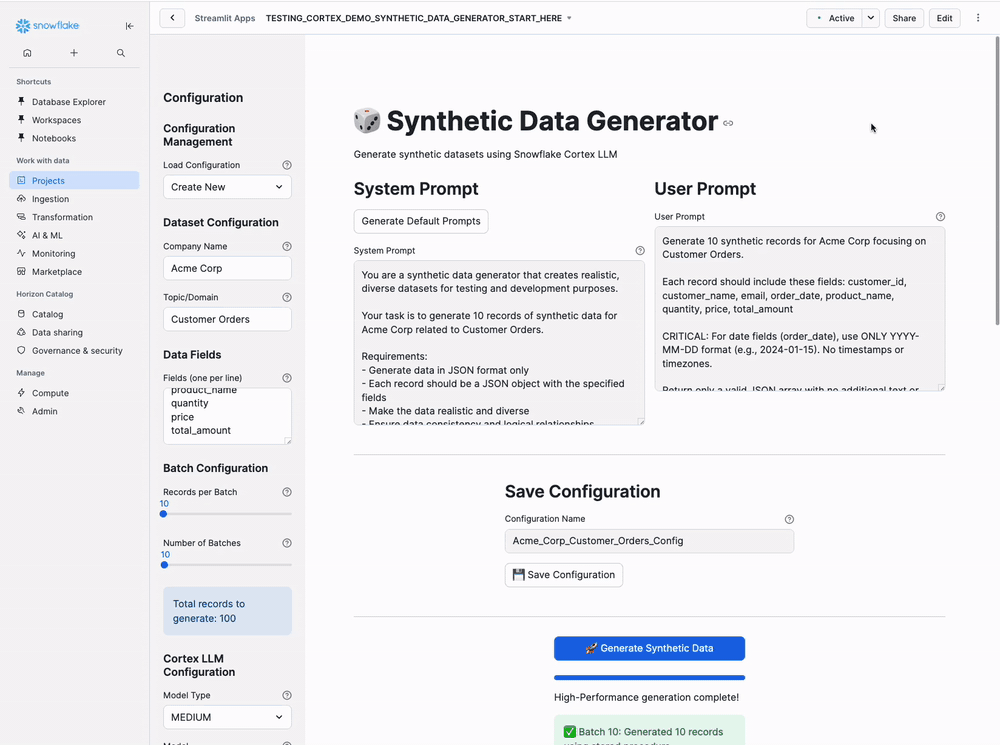
Purpose: Create realistic AI-powered datasets for any business scenario using Cortex LLMs
Dependencies: None (START HERE)
Output: Raw JSON data saved to BRONZE_LAYER tables
Who Uses This App
All Personas start here! This is the foundation of the framework.
- Persona 1 (Full-Stack Developer): Generate 100 records for dashboards
- Persona 2 (SQL Demo Creator): Generate 150 records for presentations
- Persona 3 (Data Preparation): Generate 300+ records for ML/BI export
- Persona 4 (Dashboard Consumer): Your colleague uses this to create data for you
Step-by-Step Instructions
Step 1: Open the App
Navigate to Projects → Streamlit → SYNTHETIC_DATA_GENERATOR
Step 2: Configuration Management (Optional)
Left Sidebar - Top Section:
For first-time use, leave "Load Configuration" as Create New. If you have saved configurations, select one from dropdown and click 📁 Load Configuration.
Step 3: Dataset Configuration
Left Sidebar:
Enter your company name and topic/domain:
Acme Corp
Customer Orders
Other Examples:
- ShopSmart + "Product Sales"
- MedCenter + "Patient Vitals"
- FinanceFirst + "Loan Applications"
Step 4: Define Data Fields
Left Sidebar - Fields Section:
Enter your fields (one per line):
customer_id
customer_name
email
order_date
product_name
quantity
price
total_amount
Tips:
- One field per line
- Use descriptive field names
- Include date fields for time-series analysis
- Add 6-10 fields for realistic datasets
Step 5: Batch Configuration
Left Sidebar:
Set your batch configuration using the sliders:
- Records per Batch:
10(Slider: 10-200, step 10) - Number of Batches:
10(Slider: 1-1000) - Total records to generate:
100
Why smaller batches?
- Higher accuracy (95%+ valid JSON)
- Faster generation per batch
- Better error recovery
Step 6: Configure Cortex LLM
Left Sidebar:
Configure the Cortex LLM settings:
- Model Type:
LARGE(Options: SMALL, MEDIUM, LARGE) - Model:
mistral-large2(Recommended for consistent results) - Temperature:
0.7(Slider: 0.0-1.0, step 0.1) - Max Tokens:
4000(Slider: 100-8000, step 100)
Step 7: Performance Configuration
Left Sidebar:
- ☑ High-Performance Mode (Uses stored procedures - RECOMMENDED)
- ☐ Show Manual Scripts (Leave unchecked unless you need SQL)
Keep "High-Performance Mode" checked for best results!
Step 8: Auto-save Configuration
Left Sidebar:
Check the following options:
- ☑ Auto-save batches to table
- Database:
AI_FRAMEWORK_DB - Schema:
BRONZE_LAYER - Table Name:
GENERATED_DATA - ☑ Append to existing table
Step 9: Generate Data
- Click "Generate Default Prompts" → Review/edit prompts if needed
- Click "🎲 Generate Synthetic Data" → Wait ~2-3 minutes
- Watch progress: Batch 1/10... 10/10
Step 10: Verify Success
Expected Output:
Generated 100 records successfully!
Data saved to: AI_FRAMEWORK_DB.BRONZE_LAYER.GENERATED_DATA

Sample data preview:
| CUSTOMER_NAME | PRODUCT_NAME | QUANTITY | PRICE | TOTAL_AMOUNT |
|---------------|--------------|----------|-------|--------------|
| Sarah Johnson | Laptop Pro   | 1        | 1299  | 1299         |
| Mike Chen     | Wireless Mouse| 2       | 29    | 58           |
Verification Steps:
- Go to Snowsight → Data → Databases → AI_FRAMEWORK_DB → BRONZE_LAYER
- Find your table (e.g.,
GENERATED_DATA) - Click to view:
- Should see 10 rows (one per batch)
- Each row has MESSAGES column with JSON array
- Check META columns for generation metadata
Data Quality Check:
-- Run this query to check your data
SELECT
    COUNT(*) as total_batches,
    SUM(_META_RECORDS_IN_BATCH) as total_records,
    AVG(_META_RECORDS_IN_BATCH) as avg_records_per_batch,
    _META_COMPANY_NAME,
    _META_TOPIC
FROM AI_FRAMEWORK_DB.BRONZE_LAYER.GENERATED_DATA
GROUP BY _META_COMPANY_NAME, _META_TOPIC;
Expected: 10 batches, 100 total records
Step 11: Save Configuration (Optional)
Bottom of Main Panel:
Enter a configuration name and click 💾 Save Configuration:
Acme_Corp_Customer_Orders_Config
Save your configuration to reuse later with different batch sizes or models!
Common Use Cases
Retail / E-commerce
Company: ShopSmart
Topic: Product Sales
Fields: product_id, product_name, category, sale_date, sale_amount,
        customer_segment, region, payment_method
Healthcare
Company: MedCenter
Topic: Patient Vitals
Fields: patient_id, age, gender, blood_pressure_systolic,
        blood_pressure_diastolic, heart_rate, temperature,
        oxygen_saturation, recorded_date
Financial Services
Company: FinanceFirst
Topic: Loan Applications
Fields: application_id, applicant_name, loan_amount, credit_score,
        income, employment_status, application_date, approval_status
Best Practices
Start small: Test with 10 records × 10 batches first
Use mistral-large2: Best accuracy across all scenarios
Name tables descriptively: Include company/topic in table name
Save configurations: Reuse settings for consistent results
Check data quality: Verify first batch before generating more
Use appropriate temperature: Low for factual, high for creative
What's Next?
For All Personas: → Continue to Page 7 (App 2 - Structured Tables) to transform your data from BRONZE_LAYER to SILVER_LAYER
Your data is now in raw JSON format. App 2 will clean and structure it into proper database columns!
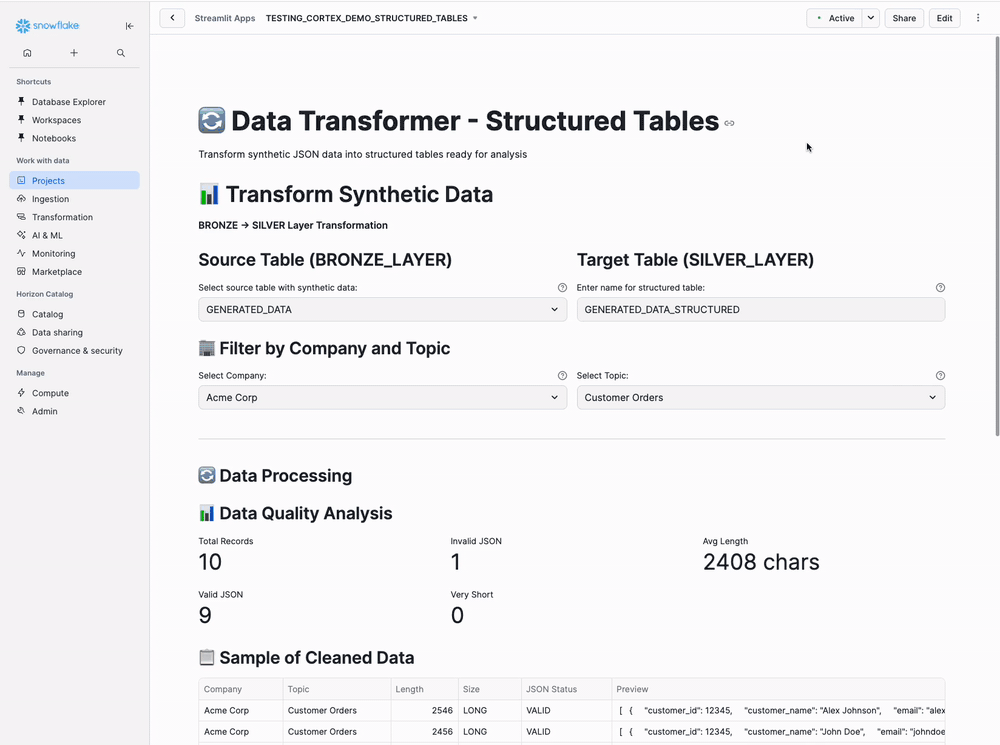
Purpose: Transform raw JSON data into clean, structured database tables
Dependencies: Requires data from App 1
Output: Analytics-ready data in SILVER_LAYER tables
Who Uses This App
- Persona 1 (Full-Stack Developer): Transform to structured tables for dashboards
- Persona 2 (SQL Demo Creator): Clean data for SQL presentations
- Persona 3 (Data Preparation): Structure data before export to ML/BI tools
- Persona 4 (Dashboard Consumer): Your colleague uses this to prepare data
Step-by-Step Instructions
Step 1: Open the App
Navigate to Projects → Streamlit → STRUCTURED_TABLES
Step 2: Select Source Table
Main Panel - Left Column:
Select source table with synthetic data from the dropdown (e.g., GENERATED_DATA).
The dropdown shows all tables from BRONZE_LAYER that contain a MESSAGES column (generated by Synthetic Data Generator).
Step 3: Configure Target Table Name
Main Panel - Right Column:
Enter name for structured table (e.g., GENERATED_DATA_STRUCTURED).
The app auto-fills this by adding _STRUCTURED to your source table name. You can customize it if needed.
Step 4: Filter by Company and Topic
Main Panel - Filter Section:
Select the company and topic you used when generating data in Step 1 from the dropdowns (e.g., Acme Corp and Customer Orders).
These dropdowns populate automatically from your source table's metadata (_meta_company_name and _meta_topic columns).
Step 5: Review Data Quality Analysis
Auto-generated after selection:
📊 Data Quality Analysis

Left Column:
Total Records: 10
Valid JSON: 10

Middle Column:
Invalid JSON: 0
Very Short: 0

Right Column:
Avg Length: 2,500 chars
What to look for:
- Valid JSON should match Total Records (if using mistral-large2)
- Invalid JSON should be 0 or very low
- Very Short indicates truncated records
Step 6: Preview Sample Data
Sample of Cleaned Data section:
| MESSAGES | _META_COMPANY_NAME | _META_TOPIC | _META_RECORDS_IN_BATCH |
|----------|-------------------|-------------|------------------------|
| [{"customer_id": 1, ...}] | Acme Corp | Customer Orders | 10 |
This shows your raw BRONZE_LAYER data with JSON arrays in the MESSAGES column.
Step 7: Review Fields Analysis
Auto-detected fields:
🔍 Fields Analysis

Found 8 fields: customer_id, customer_name, email, order_date,
                 product_name, quantity, price, total_amount

📝 View SQL Column Names (expandable):
SQL column names: CUSTOMER_ID, CUSTOMER_NAME, EMAIL, ORDER_DATE,
                  PRODUCT_NAME, QUANTITY, PRICE, TOTAL_AMOUNT
The app automatically detects field names from your JSON structure and shows how they'll appear as SQL column names (uppercase).
Verify all your expected fields are detected!
Step 8: Transform Data
Bottom Section:
Configuration name:
Acme_Corp_Customer_Orders_GENERATED_DATA
- Optional: Edit the configuration name if you want to save settings
- Click "🔄 Transform Data" button
Progress indicator:
Transforming data...
This process:
- Cleans LLM artifacts from JSON
- Flattens JSON arrays to individual rows
- Creates structured table in
SILVER_LAYER - Validates data quality
Expected time: 30 seconds to 2 minutes depending on data volume
Step 9: Verify Success
Expected Output:
Successfully transformed data to table: GENERATED_DATA_STRUCTURED

📋 Sample of Transformed Data

| CUSTOMER_ID | CUSTOMER_NAME | EMAIL | ORDER_DATE | PRODUCT_NAME | QUANTITY | PRICE | TOTAL_AMOUNT |
|-------------|---------------|-------|------------|--------------|----------|-------|--------------|
| 1 | Sarah Johnson | sarah.j@email.com | 2024-03-15 | Laptop Pro | 1 | 1299 | 1299 |
| 2 | Mike Chen | mike.c@email.com | 2024-03-12 | Wireless Mouse | 2 | 29 | 58 |

📊 Transformation Summary:
Records processed: 100
Target table: AI_FRAMEWORK_DB.SILVER_LAYER.GENERATED_DATA_STRUCTURED
What happened:
- Before: 10 rows in BRONZE_LAYER (batches with JSON arrays)
- After: 100 rows in SILVER_LAYER (individual records with columns)
Step 10: Verify in Snowsight
Verification Steps:
- Go to Snowsight → Data → Databases → AI_FRAMEWORK_DB → SILVER_LAYER
- Find your table (e.g.,
GENERATED_DATA_STRUCTURED) - Click to view data
- Verify:
- Row count matches expected (e.g., 100 individual records)
- All columns are present
- Data looks clean and realistic
Data Quality Check:
-- Run this query to verify your structured data
SELECT
    COUNT(*) as total_records,
    COUNT(DISTINCT customer_name) as unique_customers,
    MIN(order_date) as earliest_order,
    MAX(order_date) as latest_order,
    SUM(total_amount) as total_revenue
FROM AI_FRAMEWORK_DB.SILVER_LAYER.GENERATED_DATA_STRUCTURED;
Step 11: Save Configuration (Optional)
If you clicked "💾 Save Configuration" before transforming, your settings are saved for reuse:
- Source table selection
- Target table name
- Company and topic filters
Load it next time from the configuration dropdown!
Understanding the Transformation
What This App Does
1. Cleans LLM Artifacts:
- Removes incomplete JSON structures
- Fixes truncated records
- Strips LLM wrapper text
2. Flattens JSON Arrays:
Before (BRONZE_LAYER):
[{"customer_id": 1, ...}, {"customer_id": 2, ...}]  ← 1 row, many records

After (SILVER_LAYER):
Row 1: customer_id=1, customer_name=..., email=...
Row 2: customer_id=2, customer_name=..., email=...  ← Many rows, structured columns
3. Creates Proper SQL Table:
- Each field becomes a column
- Each JSON object becomes a row
- Data types inferred automatically
- Ready for SQL queries and analysis
Data Flow
BRONZE_LAYER (Raw Synthetic Data)
├─ Table: GENERATED_DATA
├─ Structure: Batched JSON arrays
├─ Columns: MESSAGES, _META_* fields
└─ Rows: 10 (one per batch)

         ↓ Transform ↓

SILVER_LAYER (Structured Data)
├─ Table: GENERATED_DATA_STRUCTURED
├─ Structure: Individual records in columns
├─ Columns: CUSTOMER_ID, CUSTOMER_NAME, EMAIL, ORDER_DATE, etc.
└─ Rows: 100 (individual records)
Common Use Cases
For Dashboard Building (Persona 1)
After transformation, your data is ready for:
- YAML Wizard (create dashboard configs)
- Snow Viz (render dashboards)
- Direct SQL analysis
For SQL Demos (Persona 2)
Structured tables work with:
- SQL to YAML Converter
- Snow Demo presentations
- Custom SQL queries
For Data Export (Persona 3)
Export structured data via:
-- Export to CSV
SELECT *
FROM AI_FRAMEWORK_DB.SILVER_LAYER.GENERATED_DATA_STRUCTURED;

-- Use in Python/Snowpark
session.table("AI_FRAMEWORK_DB.SILVER_LAYER.GENERATED_DATA_STRUCTURED").to_pandas()

-- Connect BI tools directly to SILVER_LAYER tables
What's Next?
For Persona 1 (Full-Stack Developer): → Continue to Page 10 (YAML Wizard) to create dashboard configurations
For Persona 2 (SQL Demo Creator): → Continue to Page 8 (SQL to YAML Converter) to create demo flows
For Persona 3 (Data Preparation): → Export your data from SILVER_LAYER or continue to other apps
For All Personas: Your data is now in clean, structured format in SILVER_LAYER - ready for analytics, dashboards, demos, or export!
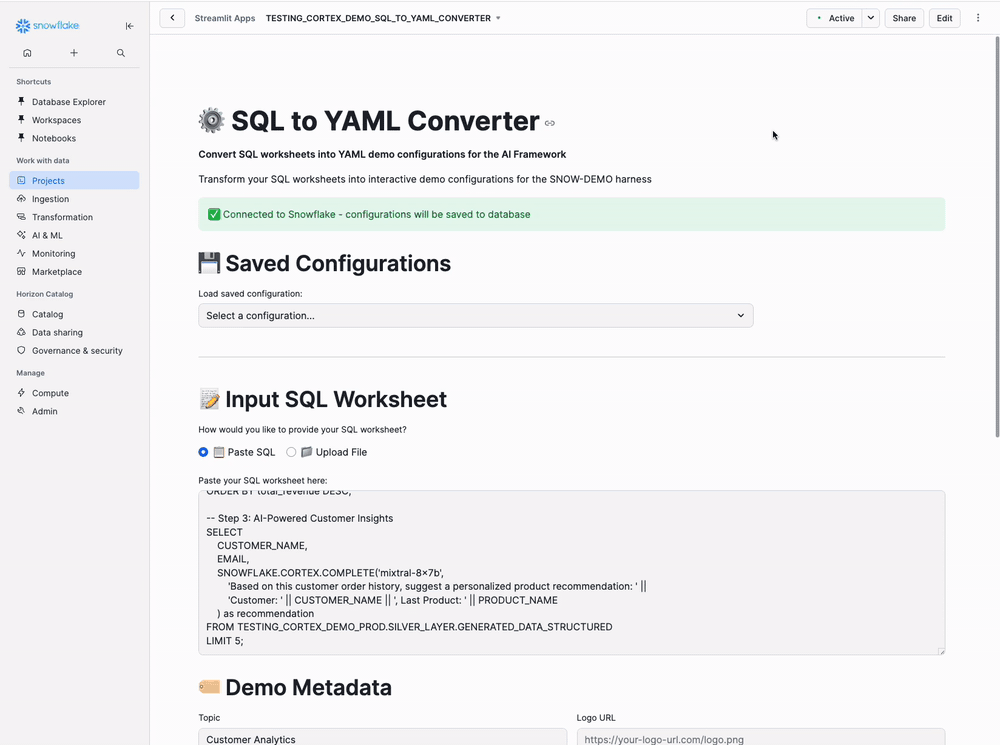
Purpose: Convert SQL queries into interactive demo configurations for Snow Demo
Dependencies: Requires tables from App 1 or 2
Output: YAML files for FRAMEWORK_YAML_STAGE
Who Uses This App
- Persona 2 (SQL Demo Creator): Convert SQL queries to demo YAML for interactive presentations
Step-by-Step Instructions
Step 1: Open the App
Navigate to Projects → Streamlit → SQL_TO_YAML_CONVERTER
Step 2: Choose Input Method
Main Panel - Input SQL Worksheet Section:
Choose Input Method:
◉ Paste SQL
○ Upload File
Select Paste SQL to enter your queries directly, or Upload File to upload a .sql or .txt file.
Step 3: Enter Your SQL Queries
SQL Input Text Area:
Replace the placeholder SQL with your actual queries from the structured tables you created:
-- Step 1: Customer Overview
SELECT
    CUSTOMER_NAME,
    EMAIL,
    ORDER_DATE,
    PRODUCT_NAME,
    TOTAL_AMOUNT
FROM AI_FRAMEWORK_DB.SILVER_LAYER.GENERATED_DATA_STRUCTURED
LIMIT 10;

-- Step 2: Revenue by Product
SELECT
    PRODUCT_NAME,
    COUNT(*) as order_count,
    SUM(TOTAL_AMOUNT) as total_revenue,
    AVG(TOTAL_AMOUNT) as avg_order_value
FROM AI_FRAMEWORK_DB.SILVER_LAYER.GENERATED_DATA_STRUCTURED
GROUP BY PRODUCT_NAME
ORDER BY total_revenue DESC;

-- Step 3: Top Customers Analysis
SELECT
    CUSTOMER_NAME,
    COUNT(*) as total_orders,
    SUM(TOTAL_AMOUNT) as total_spent,
    AVG(TOTAL_AMOUNT) as avg_order_value
FROM AI_FRAMEWORK_DB.SILVER_LAYER.GENERATED_DATA_STRUCTURED
GROUP BY CUSTOMER_NAME
ORDER BY total_spent DESC
LIMIT 10;
Tips:
- Use your actual table names from Structured Tables
- Include Cortex AI functions for interactive demos
- Separate steps with SQL comments (
-- Step X:) - Mix different query types (SELECT, GROUP BY, Cortex functions)
Step 4: Configure Demo Metadata
Demo Metadata Section (Two Columns):
Left Column:
Topic:
Customer Analytics
Sub-topic:
Order Analysis
Tertiary Topic:
Revenue Insights
Title:
Acme Corp Customer Orders Analytics Dashboard
Right Column:
Logo URL: (optional - leave blank)
Owner:
Data Analytics Team
Database: (leave blank to auto-detect)
Schema: (leave blank to auto-detect)
Overview Description:
Comprehensive analysis of Acme Corp customer order data showcasing:
- Customer order patterns and revenue trends
- Top-performing products and customer segments
- AI-powered customer insights and recommendations
Tips:
- Keep Topic/Sub-topic/Tertiary Topic hierarchical (broad → specific)
- Title is the main heading users see
- Use bullet points with
-for better formatting in Overview
Step 5: Configure Advanced Options (Optional)
Expandable Advanced Options Section:
SQL Block Separator: GO
Role: (leave blank)
Warehouse: (leave blank)
Default settings work for most cases. Only change if you have specific requirements.
Step 6: Parse SQL Worksheet
Bottom of Input Section:
Click the blue [Parse SQL Worksheet] button
What happens:
- App analyzes your SQL queries
- Detects Cortex AI functions automatically
- Suggests visualizations based on query patterns:
GROUP BY→ Bar ChartSELECT *→ Table- Cortex functions → Interactive AI steps
- Comments out unsupported commands (USE statements)
- Generates YAML configuration
Processing time: ~5-10 seconds
Step 7: Review Summary Tab
Results Section - Tab 1 (Summary):
Key Metrics:
- 3 Total Steps
- 1 Table Referenced
- 2 Visualization Types

Cortex AI Analysis:
- 0 Cortex Complete calls detected
- 0 Interactive Cortex steps created

Interactive Steps:
- None (add CORTEX.COMPLETE() for interactive AI steps)
This shows what the app detected in your SQL and how it will be presented in Snow Demo.
Step 8: Review Parsed Blocks Tab
Results Section - Tab 2 (Parsed Blocks):
Step 1: Customer Overview
- Type: Query
- Visualization: Table
- SQL: SELECT CUSTOMER_NAME, EMAIL...

Step 2: Revenue by Product
- Type: Query
- Visualization: Bar Chart
- SQL: SELECT PRODUCT_NAME, COUNT(*) as order_count...

Step 3: Top Customers Analysis
- Type: Query
- Visualization: Table
- SQL: SELECT CUSTOMER_NAME, COUNT(*) as total_orders...
Verify all your steps are correctly parsed and visualization types make sense.
Step 9: Review Generated YAML
Results Section - Tab 3 (Generated YAML):
Shows the complete YAML configuration that will be used by Snow Demo. This includes:
- Metadata (topic, title, owner)
- SQL steps with visualization configurations
- Interactive Cortex AI steps
- Execution flow
You don't need to edit this manually - it's automatically generated!
Step 10: Download or Save Configuration
Results Section - Tab 4 (Download & Export):
Configuration Name:
Customer_Analytics_Order_Analysis_Revenue_Insights_20250115
Option 1: Save to Database (Recommended)
- Click "Save to Database" button
- Config saved to
AI_FRAMEWORK_DB.CONFIG.DEMO_CONFIGURATIONS
Option 2: Download YAML File
- Click "Download YAML Configuration" button
- Downloads
.yamlfile for uploading to Snow Demo stage
What This App Does Automatically
SQL Analysis:
- Detects all Cortex AI function calls
- Identifies aggregation patterns (GROUP BY, SUM, AVG)
- Recognizes table and database references
- Comments out unsupported SQL commands
Visualization Suggestions:
GROUP BYqueries → Bar Chart visualizations- Simple SELECT queries → Table views
- Cortex functions → Interactive experimentation panels
Interactive AI Steps:
- Extracts prompts from
CORTEX.COMPLETE()calls - Creates editable prompt interfaces
- Allows real-time model/parameter changes
- Shows AI responses in demo flow
YAML Generation:
- Professional demo structure
- Compatible with Snow Demo harness
- Ready for presentations
- No manual YAML writing needed
Example SQL Patterns
Basic Analytics Query
-- Shows as Table view
SELECT customer_name, order_date, total_amount
FROM my_table
LIMIT 10;
Aggregation Query
-- Shows as Bar Chart
SELECT product_category, SUM(revenue) as total_revenue
FROM my_table
GROUP BY product_category
ORDER BY total_revenue DESC;
Interactive Cortex AI
-- Shows as Interactive AI Panel
SELECT
    SNOWFLAKE.CORTEX.COMPLETE('mixtral-8x7b',
        'Analyze this data: ' || column_name
    ) as ai_insights
FROM my_table;
Best Practices
Write clear SQL comments: Use -- Step X: format for step detection
Include Cortex AI: Add CORTEX.COMPLETE() for interactive demos
Mix query types: Combine SELECT, GROUP BY, and AI functions
Use descriptive metadata: Clear titles and topics help viewers understand
Test queries first: Run SQL in worksheet before converting
What's Next?
For Persona 2 (SQL Demo Creator):
- Upload your YAML to Snowflake Stage (see upload instructions in Snow Demo section below)
- Continue to Page 9 (Snow Demo) to run your interactive presentation
Your SQL queries are now a professional, interactive demo ready for presentations!
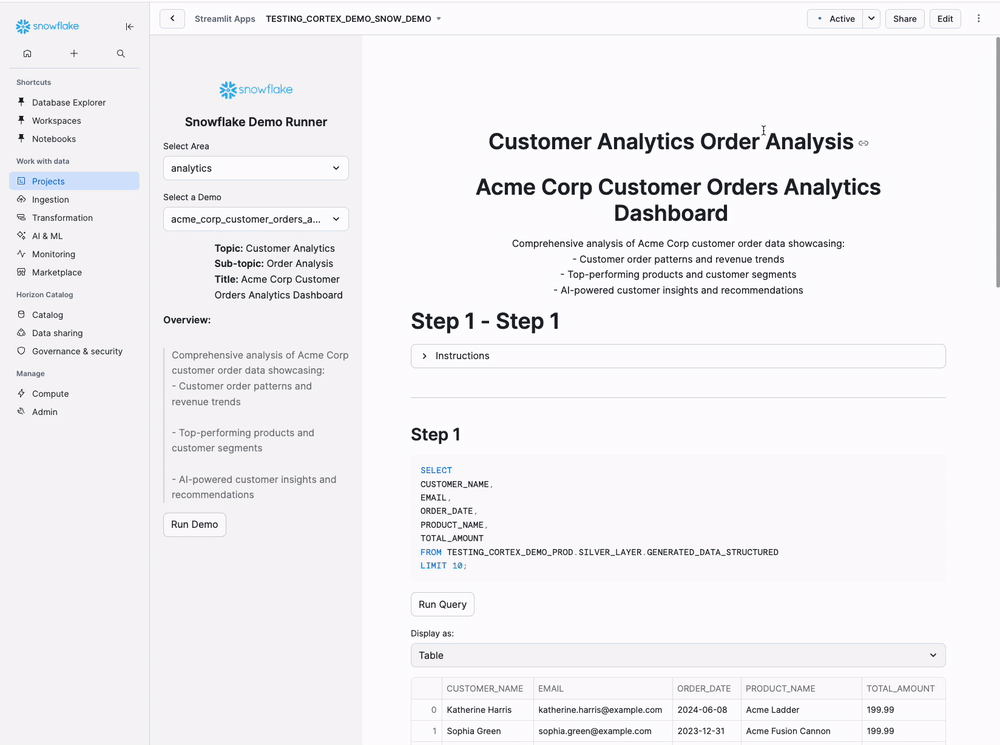
Purpose: Run interactive SQL-driven presentations with live visualizations
Dependencies: Requires YAML configs from App 3 (uploaded to FRAMEWORK_YAML_STAGE)
Output: Live demo orchestration with charts and AI experimentation
Who Uses This App
- Persona 2 (SQL Demo Creator): Present interactive SQL demos with live AI experimentation
Upload YAML to Stage
Before using Snow Demo, upload your YAML file to Snowflake:
- Navigate to Data → Databases → AI_FRAMEWORK_DB → CONFIGS → Stages → FRAMEWORK_YAML_STAGE
- Click "+ Files" button
- Select your downloaded YAML file
- In path field, enter:
/analytics/(or choose:sales_demo,customer_insights, etc.) - Click "Upload"
Step-by-Step Instructions
Step 1: Open the App
Navigate to Projects → Streamlit → SNOW_DEMO
Step 2: Select Area
Left Sidebar: Select the project directory where you uploaded your YAML file (e.g., analytics)
Step 3: Select Demo
Left Sidebar: Select your YAML configuration file from the dropdown
Step 4: Review and Run Demo
Left Sidebar: Review the auto-displayed demo metadata, then click [Run Demo]
Step 5: Navigate Demo Steps
Main Panel: Each SQL step appears as a section with:
- Auto-executed query results
- Visualization selector (Table, Bar Chart, Line Chart, etc.)
- Optional instructions and talk track
Tips: Change Display Options dropdown to switch visualizations on-the-fly
Step 6: Interactive Cortex AI (Optional)
If your SQL includes SNOWFLAKE.CORTEX.COMPLETE() calls, you'll see an interactive panel where you can:
- Change the AI model (llama3.1-8b, mixtral-8x7b, etc.)
- Adjust temperature and max tokens
- Edit system and user prompts live
- Re-run queries with different parameters
Best Practices
Prepare ahead: Test demo flow before presentations
Use talk tracks: Add presenter notes in YAML for guidance
Practice transitions: Know when to switch visualizations
Engage audience: Ask for prompt suggestions during AI steps
Keep queries fast: Use LIMIT clause for demo data
What's Next?
For Persona 2 (SQL Demo Creator):
Your demo is complete! You can:
- Run this demo in presentations
- Create additional demos with different SQL queries
- Edit YAML to add more steps or visualizations
- Share demo with colleagues by sharing the YAML file
Return to Page 5 to explore other workflows or continue to Page 12 for cleanup instructions.
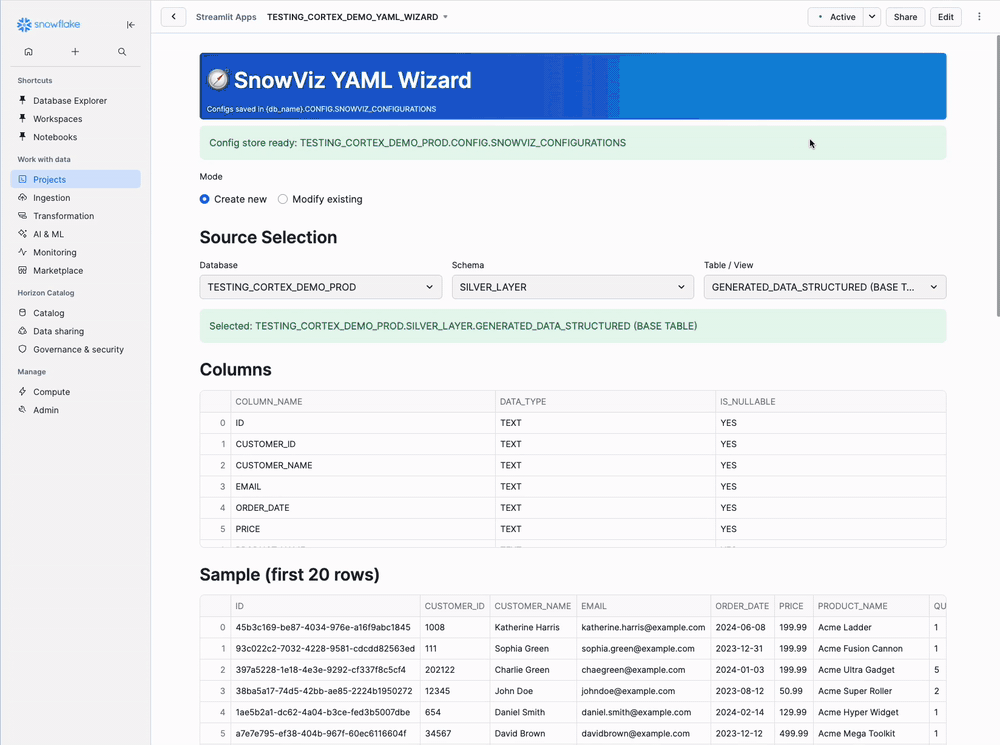
Purpose: Create dashboard configurations through guided interface
Dependencies: Requires tables from App 1 or 2
Output: YAML files for VISUALIZATION_YAML_STAGE
Who Uses This App
- Persona 1 (Full-Stack Developer): Create dashboard YAML from structured tables for Snow Viz
Step-by-Step Instructions
Step 1: Open the App
Navigate to Projects → Streamlit → YAML_WIZARD
Step 2: Select Data Source
Main Panel - Top Section:
◉ Create new (selected by default)
○ Load existing

Database: AI_FRAMEWORK_DB ▼
Schema: SILVER_LAYER ▼
Table: TECHCORP_ORDERS_STRUCTURED ▼
Schema Selection Guide:
- SILVER_LAYER: Use if you completed Structured Tables (recommended)
- BRONZE_LAYER: Use if working with raw data directly
Select your structured table from the previous steps.
Step 3: Configure Dimensions and Metrics
Configure Dimensions, Metrics, Time Column Section:
Dimensions (Left Column):
Select text/categorical fields to group by:
☑ CUSTOMER_NAME
☑ PRODUCT_NAME
☐ EMAIL
☐ ...
Check 2-5 key categorical fields you want to analyze.
Time Column (Right Column):
Time Column for Trends:
ORDER_DATE ▼
Select your date/timestamp field for time-series analysis.
Metrics (Below Columns):
Auto-generated metrics from your table:
☑ total_rows (COUNT(*))
☑ avg_quantity (AVG(QUANTITY))
☑ sum_total_amount (SUM(TOTAL_AMOUNT))
☑ avg_price (AVG(PRICE))
☐ ...
Check 3-7 key metrics you want to calculate. The app automatically creates aggregation functions.
Tips:
- Don't check ALL metrics - pick the most important 5-10
- Dimensions are for grouping (categories, names)
- Metrics are for calculations (numbers, aggregations)
Step 4: Customize Dimensions
Click the "Dimensions" tab
For each dimension, you can customize:
CUSTOMER_NAME:
Label: Customer Name
Description: Customer who placed the order
Priority: 0
Unique Values: (auto-detected)

PRODUCT_NAME:
Label: Product
Description: Product purchased
Priority: 1
What to customize:
- Label: User-friendly display name (e.g., "Product Category" instead of "PRODUCT_NAME")
- Description: Help text for users
- Priority: Display order (0 = first, 1 = second, etc.)
IMPORTANT: After editing, click "Apply All Dimension Changes" button at the bottom!
Step 5: Customize Metrics
Click the "Metrics" tab
For each metric, you can customize:
total_rows:
Label: Total Orders
SQL: COUNT(*)
Format: number
Decimals: 0

sum_total_amount:
Label: Total Revenue
SQL: SUM(TOTAL_AMOUNT)
Format: currency
Decimals: 2

avg_price:
Label: Average Price
SQL: AVG(PRICE)
Format: currency
Decimals: 2
What to customize:
- Label: User-friendly display name
- SQL: The aggregation function (modify if needed)
- Format: number, percent, currency, integer
- Decimals: Decimal places to display
IMPORTANT: After editing, click "Apply All Metric Changes" button at the bottom!
Step 6: Generate Dashboard YAML
Click the "Generate" tab, then enter:
App Name:
Acme Corp Customer Orders Dashboard
Description:
Comprehensive analysis of customer order data
YAML Filename:
acme_corp_orders_dashboard.yaml
Click "Generate Customized YAML" → Generates 8 tabs (Overview, Product/Category, VS, Top N, Self Service, Search, AI Assistant, Raw Data)
Step 7: Download and Save
Click "Download YAML" button
Optional: Click "Save to AI_FRAMEWORK_DB.CONFIGS" to save your customizations for later editing
Upload YAML to Stage for Snow Viz
Upload your YAML file to Snowflake:
- Navigate to Data → Databases → AI_FRAMEWORK_DB → CONFIGS → Stages → VISUALIZATION_YAML_STAGE
- Click "+ Files" button
- Select your downloaded YAML file
- In path field, enter:
/customer_orders/(or your project name) - Click "Upload"
Understanding the Output
What You Created:
- YAML Configuration File: Recipe for your dashboard
- 8 Interactive Tabs: Different ways to explore your data
- Customized Labels: User-friendly names for dimensions and metrics
- Formatted Metrics: Currency, percentages, decimals as configured
Why Two Saves?:
- Download YAML: For uploading to stage (Snow Viz needs this)
- Save to CONFIGS: For editing later (preserves your customizations)
What to Ignore (Normal Messages)
These messages are NORMAL for first-time use:
No Cortex Search services found in this database/schema
Create a Cortex Search service first to enable semantic search
Ignore this - Search services are advanced/optional
Table exists but no configurations found
No configs saved yet.
Configuration table has 0 saved configs
Ignore this - Normal until you save your first config
Best Practices
Start simple: Pick 2-3 dimensions and 3-5 metrics for first try
Use clear labels: "Product Category" is better than "PRODUCT_CATEGORY"
Format metrics: Use currency for money, percent for rates
Save your work: Both download AND save to database
Test in Snow Viz: Verify dashboard works as expected
What's Next?
For Persona 1 (Full-Stack Developer):
You now have a dashboard configuration file! Next steps:
- Upload YAML to stage (instructions above)
- Continue to Page 11 (Snow Viz) to view your interactive dashboard
Your data is now ready for visual analytics with 8 interactive dashboard tabs!
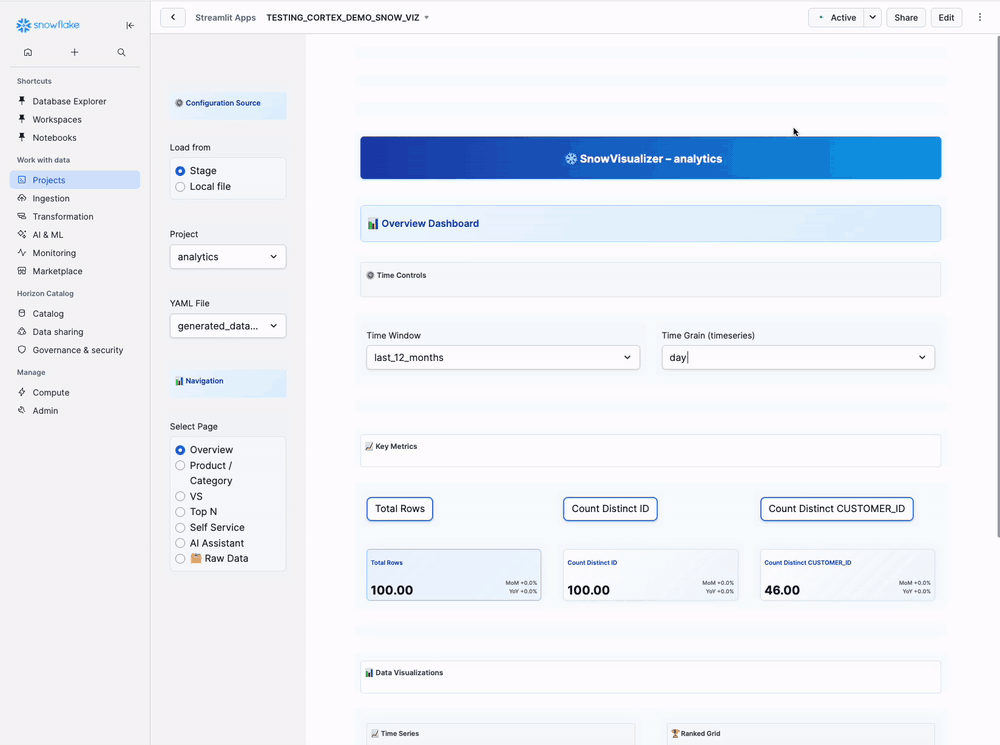
Purpose: Render advanced interactive dashboards from YAML configurations
Dependencies: Requires YAML configs from App 5 (uploaded to VISUALIZATION_YAML_STAGE)
Output: Multi-tab analytics dashboards with AI integration
Who Uses This App
- Persona 1 (Full-Stack Developer): View and validate dashboards after creation
- Persona 4 (Dashboard Consumer): Explore interactive dashboards and run natural language queries
Step-by-Step Instructions
Step 1: Open the App
Navigate to Projects → Streamlit → SNOW_VIZ
Step 2: Select Configuration Source
Left Sidebar - Configuration Source:
Load from:
◉ Stage
○ Local file
Select Stage (recommended - loads from VISUALIZATION_YAML_STAGE)
Step 3: Select Project and YAML File
Left Sidebar - After selecting Stage:
Project: [Select Project] ▼
Available: techcorp_orders, analytics, sales_dashboard

YAML File: [Select YAML] ▼
Available: techcorp_orders_dashboard.yaml
- Select Project: Choose the directory where you uploaded your YAML
- Select YAML File: Choose your dashboard configuration file
The dashboard will automatically load.
Step 4: Navigate Dashboard Tabs
Left Sidebar - Navigation Section:
Select Page:
◉ Overview
○ Product / Category
○ VS (Compare)
○ Top N
○ Self Service
○ Search
○ AI Assistant
○ Raw Data
Each tab provides different analytical views of your data.
Tab 1: Overview Dashboard
Main Panel - Overview Tab:
Time Controls (Top):
Time Window: last_3_months ▼
Options: last_7_days, last_30_days, last_3_months, last_6_months, last_year, all_time

Time Grain: month ▼
Options: day, week, month, quarter, year
Key Metrics Cards:
[Total Orders]        [Total Revenue]       [Average Price]
1,234                $156,789              $127.15
↑ 12% vs prev        ↑ 8% vs prev         ↓ 3% vs prev
Metric cards are interactive - click to select which metric to visualize below.
Visualizations:
Left Side: Time Series Chart
Shows trend line for selected metric over time
- X-axis: Time periods (based on Time Grain)
- Y-axis: Metric values
- Hover for exact values
Right Side: Ranked Grid
Dimension: [Select Dimension] ▼
Shows top 10 results in table format:
| Product Name    | Total Revenue | % of Total |
|----------------|---------------|------------|
| Laptop Pro     | $45,678      | 29%        |
| Wireless Mouse | $23,456      | 15%        |
Tab 2: Product / Category (Drill-Down)
Dimension Analysis:
Select Dimension: PRODUCT_NAME ▼
Options: All configured dimensions

Select Metric: Total Revenue ▼
Options: All configured metrics
Shows detailed breakdown by selected dimension with:
- Bar chart visualization
- Data table with all values
- Filtering and sorting capabilities
Tab 3: VS (Compare Entities)
Side-by-Side Comparison:
Left Entity: [Select] ▼
Right Entity: [Select] ▼

Metrics to Compare:
☑ Total Orders
☑ Total Revenue
☑ Average Price
☐ ...
Comparison Table:
| Metric        | Laptop Pro | Wireless Mouse | Winner        | Delta    |
|--------------|------------|----------------|---------------|----------|
| Total Orders | 456        | 789            | Wireless Mouse| +73%     |
| Total Revenue| $45,678    | $23,456        | Laptop Pro    | +95%     |
Perfect for comparing products, customers, or any dimension values.
Tab 4: Top N (Rankings)
Leaderboard Analysis:
Select Dimension: PRODUCT_NAME ▼
Select Metric: Total Revenue ▼
Top N: 10 ▼
Options: 5, 10, 20, 50, 100

Sort Order:
◉ Descending (highest first)
○ Ascending (lowest first)
Shows ranked list with:
- Bar chart visualization
- Numeric rankings
- Percentage of total
Tab 5: Self Service
Custom Analysis:
Select Dimensions (grouping):
☑ PRODUCT_NAME
☑ CUSTOMER_NAME
☐ ...

Select Metrics (calculations):
☑ Total Revenue
☑ Average Price
☐ ...

Time Range: last_3_months ▼
Build custom reports by selecting any combination of dimensions and metrics.
Results show in interactive data table with:
- Sorting by any column
- Filtering capabilities
- Export to CSV option
Tab 6: AI Assistant (Natural Language Queries)
Powered by Cortex Analyst:
Type your question in natural language:
What are the top 3 products by revenue in the last quarter?
Click [Ask Analyst] → Select view option (Grid, Bar, or Line chart)
AI Narrative (Optional): Generate AI analysis by selecting a model, adjusting temperature, and clicking [Generate Analysis]
Example Questions:
- "What is the average revenue per customer?"
- "Show me products with revenue greater than $10,000"
- "Which month had the highest number of orders?"
- "Compare revenue between Electronics and Software categories"
Tab 7: Search (Cortex Search)
Semantic Search (if configured):
Enter your search query:
laptop with high ratings
Click [Search] → Shows relevant records based on semantic similarity
Note: Requires Cortex Search service to be configured. If not set up, this tab will show a setup message.
Tab 8: Raw Data
Shows complete dataset in table format with sortable columns and CSV export option.
Use this tab to:
- Verify data quality
- Export raw data
- See all available fields
Dashboard Features
Interactive Elements:
- Click metric cards to change visualizations
- Hover over charts for detailed values
- Sort tables by any column
- Filter and drill down into data
- Export results to CSV
Time Controls:
- Adjust time windows dynamically
- Change time grain (day/week/month)
- See period-over-period comparisons
- View trends over time
AI Integration:
- Natural language queries (Cortex Analyst)
- AI-generated narratives (Cortex Complete)
- Semantic search (Cortex Search, if configured)
Use Cases
For Persona 1 (Full-Stack Developer)
- Validate dashboard configuration
- Test all tabs and features
- Verify metrics calculate correctly
- Share with business users
For Persona 4 (Dashboard Consumer)
- Explore business metrics
- Ask questions in plain English
- Compare entities side-by-side
- Export data for presentations
Best Practices
Explore systematically: Start with Overview, then drill into specific tabs
Use AI Assistant: Natural language queries are powerful and intuitive
Compare entities: VS tab helps identify top performers
Export insights: Share findings via CSV export
Adjust time windows: Find the right time range for your analysis
What's Next?
For Persona 1 (Full-Stack Developer):
Your complete analytics pipeline is built! You've created:
- Synthetic data (Synthetic Data Generator)
- Structured tables (Structured Tables)
- Dashboard configuration (YAML Wizard)
- Interactive dashboard (Snow Viz)
Share your dashboard with business users and stakeholders!
For Persona 4 (Dashboard Consumer):
You now have an interactive analytics dashboard! You can:
- Explore metrics and trends
- Ask questions in plain English
- Compare products/customers/categories
- Export data for presentations
Return to Page 5 to explore other workflows or continue to Page 12 for cleanup instructions.
Remove All Created Objects
When you're ready to remove all the resources created during this quickstart:
- Open the setup.sql script
- Scroll to the bottom to find the "TEARDOWN SCRIPT" section
- Uncomment the teardown statements
- Run the freshly uncommented script to remove all databases, warehouses, roles, and objects
This will clean up all framework components while preserving any other work in your Snowflake account.
Congratulations! You've successfully built the complete Cortex AI Demo Framework using Snowflake Cortex AI!
What You Learned
- 6-Application Demo Platform: How to build complete demo infrastructure from data generation to visualization
- Persona-Based Workflows: How different roles use the framework for their specific needs
- Advanced AI Processing: How to implement Cortex AI integration with SENTIMENT, EXTRACT_ANSWER, and COMPLETE functions
- Production-Ready Streamlit Apps: How to develop interactive demo platforms with advanced visualizations
- Rapid Demo Development: How to transform weeks of development into minutes of setup