Snowflake is a terrific platform on which to build data applications. The unique characteristics and cloud-based design allow for building applications that scale with data and workload. This tutorial will go through how to build and deploy both the Processing Layer and the User Interface Layer paired with Snowflake as the Persistence Layer.
Our example will be using a fictional food truck franchise website, Tasty Bytes. We will be building a graphical user interface with charts and graphs for franshisees to be able to examine sales data related to their franchise of food trucks. After logging in via a login page, each franchisee will have one page that will show metrics at the franchise level, and another that will show metrics around the food truck brands for that franchise.
The Processing and User Interface Layers will be built using Node.js. The dataset is a orders history for Tasty Bytes.
Prerequisites
- A Snowflake account, and familiarity with the Snowsight interface
- Privileges necessary to create a user, database, and warehouse in Snowflake
- Ability to install and run software on your computer
- Basic experience using git
- Intermediate knowledge of Node.js and React JS
What You'll Learn
- How to configure and build a custom API Powered by Snowflake, written in Node.js
- How to configure and build a custom frontend website to communicate with the API, written in React and Node.js
- How to run and test the frontend and API on your machine
What You'll Need
What You'll Build
- API Powered by Snowflake built in Node.js
- React JS Web Application that connects to that API
Overview
In this part of the lab we'll set up our Snowflake account, create database structures to house our data, create a Virtual Warehouse to use for data loading and finally load our Tasty Bytes Food Truck orders data into our ORDERS table and run a few queries to get familiar with the data.
Step 1.1 Initial Snowflake Setup
For this part of the lab we will want to ensure we run all steps as the ACCOUNTADMIN role
-- Change role to accountadmin
use role accountadmin;
First we can create a Virtual Warehouse that can be used for data exploration and general querying in this lab. We'll create this warehouse with a size of Medium which is right sized for that use case in this lab.
-- Create a virtual warehouse for data exploration
create or replace warehouse query_wh with
	warehouse_size = 'medium'
	warehouse_type = 'standard'
	auto_suspend = 300
	auto_resume = true
	min_cluster_count = 1
	max_cluster_count = 1
	scaling_policy = 'standard';
Step 1.2 Load Data
Next we will create a database and schema that will house the tables that store our application data.
-- Create the application database and schema
create or replace database frostbyte_tasty_bytes;
create or replace schema app;
This DDL will create the structure for the ORDERS table which is the main source of data for our application in this lab.
-- Create table structure for order data
create or replace table orders (
	order_id number(38,0),
	truck_id number(38,0),
	order_ts timestamp_ntz(9),
	order_detail_id number(38,0),
	line_number number(38,0),
	truck_brand_name varchar(16777216),
	menu_type varchar(16777216),
	primary_city varchar(16777216),
	region varchar(16777216),
	country varchar(16777216),
	franchise_flag number(38,0),
	franchise_id number(38,0),
	franchisee_first_name varchar(16777216),
	franchisee_last_name varchar(16777216),
	location_id number(19,0),
	customer_id number(38,0),
	first_name varchar(16777216),
	last_name varchar(16777216),
	e_mail varchar(16777216),
	phone_number varchar(16777216),
	children_count varchar(16777216),
	gender varchar(16777216),
	marital_status varchar(16777216),
	menu_item_id number(38,0),
	menu_item_name varchar(16777216),
	quantity number(5,0),
	unit_price number(38,4),
	price number(38,4),
	order_amount number(38,4),
	order_tax_amount varchar(16777216),
	order_discount_amount varchar(16777216),
	order_total number(38,4)
);
For loading data into the ORDERS table we will create a new Virtual Warehouse sized as a Large to help us quickly ingest the data we have stored in an S3 bucket.
-- Create a virtual warehouse for data loading
create or replace warehouse load_wh with
	warehouse_size = 'large'
	warehouse_type = 'standard'
	auto_suspend = 300
	auto_resume = true
	min_cluster_count = 1
	max_cluster_count = 1
	scaling_policy = 'standard';
Next we have to create a STAGE which is a Snowflake object that points to a cloud storage location Snowflake can access to both ingest and query data. In this lab the data is stored in a publically accessible AWS S3 bucket which we are referencing when creating the Stage object.
-- Create stage for loading orders data
create or replace stage tasty_bytes_app_stage
	url = 's3://sfquickstarts/frostbyte_tastybytes/app/orders/';
Once we've created both the Virtual Warehouse we want to use for loading data and the Stage which points to where the data resides in cloud storage we can simply COPY the data from that Stage into our ORDERS table.
-- Copy data into orders table using the load wh
 copy into orders from @tasty_bytes_app_stage;
Step 1.3 Explore Data
Now that we've loaded our data into the ORDERS table we can run a few queries to get familiar with it - but first we will want to change the Virtual Warehouse we're using from the LOAD_WH back to the QUERY_WH created earlier in the lab.
-- Change our Virtual Warehouse context to use our query_wh
 use warehouse query_wh;
To begin with we can simply look at a sample of the entire table.
-- Simple query to look at 10 rows of data
select * from orders limit 10;
Next we can see how many records we've loaded into the table. Notice how quickly the query executes - this is due to Snowflake's unique architecture which enables a certain class of queries like this one to pull results from metadata instead of requiring compute to generate the result. You should see that the table has a little more than 231M rows.
-- Query to count all records in the table
select count(*) from orders;
Next we can see the date range included in our data. You should see that the data ranges from 2022-01-01 to 2022-10-31.
-- Query to find the date range of the data
select min(order_ts), max(order_ts) from orders;
Finally we can run a more complex query to look at the total revenue by month where we will use a couple of functions to parse the month number and name from the ORDER_TS column in the ORDERS table.
-- Sales by month
select month(order_ts),monthname(order_ts), sum(price)
from orders
group by month(order_ts), monthname(order_ts)
order by month(order_ts);
Overview
Now that we've done the initial set up within our Snowflake account including loading data into the ORDERS table we will focus on turning our business questions into queries for our application.
Our queries will be broken into two groups - Franchise queries and Truck Brand level queries. For the sake of ease we will focus on the following Franchise, Truck Brand, and Date Range for this part of the lab.
- Franchise:
1 - Truck Brand:
Guac n' Roll - Date Range:
2022-01-01to2022-03-31
Setting Snowsight Context
To ensure the correct context is use for these queries we will set our database, schema, and Virtual Warehouse using the following SQL:
-- Set query context
use database frostbyte_tasty_bytes;
use schema app;
use warehouse query_wh;
2.1 Franchise Queries
To answer the business questions about how our overall Franchise business is doing we'll need create the three following queries. All of the columns required for these exist in the ORDERS table and no joining of tables are required.
- Top 10 Countries Based on Revenue for Franchise 1 in the time window 2022-01-01 to 2022-03-31
- Top 10 Truck Brands Based on Revenue for Franchise 1 in the time window 2022-01-01 to 2022-03-31
- Monthly Revenue for Franchise 1 for the year 2023 per Truck Brand
You can spend some time creating the queries for each of these and then check your answers against the provided queries below by expanding each section.
Top 10 Countries Based on Revenue
SELECT
    TOP 10 country,
    sum(price) AS revenue
FROM
    app.orders
WHERE
    date(order_ts) >= '2022-01-01'
    AND date(order_ts) <= '2022-03-31'
    AND franchise_id = 1
GROUP BY
    country
ORDER BY
    sum(price) desc;
Top 10 Truck Brands Based on Revenue
SELECT
    TOP 10 truck_brand_name,
    sum(price) AS revenue
FROM
    app.orders
WHERE
    date(order_ts) >= '2022-01-01'
    AND date(order_ts) <= '2022-03-31'
    AND franchise_id = 1
GROUP BY
    truck_brand_name
ORDER BY
    sum(price) desc;
Montly Revenue per Truck Brand
SELECT
    country,
    month(order_ts) as date,
    sum(price) AS revenue
FROM
    app.orders
WHERE
        year(order_ts) = 2022
    AND franchise_id = 1
GROUP BY
    country,
    month(order_ts)
ORDER BY
    sum(price) desc;
2.2 Truck Brand Queries
Franchise owners will want to dig deeper into the data and better understand performance trends at the Truck Brand level so we'll need to create four more queries to analyze the data. All of the columns required for these exist in the ORDERS table and no joining of tables are required.
- Total Sales by Day-of-Week for Franchise 1 and the Guac n' Roll brand in the time window 2022-01-01 to 2022-03-31
- Menu Items sorted by Revenue for Franchise 1 and the Guac n' Roll brand in the time window 2022-01-01 to 2022-03-31
- Menu Items sorted by Revenue by Day-of-Week for Franchise 1 and the Guac n' Roll brand in the time window 2022-01-01 to 2022-03-31
- Cities sorted by Revenue by Day-of-Week for Franchise 1 and the Guac n' Roll brand in the time window 2022-01-01 to 2022-03-31
You can spend some time creating the queries for each of these and then check your answers against the provided queries below by expanding each section.
Total Sales by Day-of-Week
SELECT
    dayofweek(order_ts) as DoW,
    sum(price) AS revenue
FROM
    app.orders
WHERE
    date(order_ts) >= '2022-01-01'
    AND date(order_ts) <= '2022-03-31'
    AND truck_brand_name = 'Guac n'' Roll'
    AND franchise_id = 1
GROUP BY
    dayofweek(order_ts)
ORDER BY
    dayofweek(order_ts),
        sum(price) desc;
Top Selling Items
SELECT
    menu_item_name,
    sum(price) AS revenue
FROM
    app.orders
WHERE
    date(order_ts) >= '2022-01-01'
    AND date(order_ts) <= '2022-03-31'
    AND truck_brand_name = 'Guac n'' Roll'
    AND franchise_id = 1
GROUP BY
    menu_item_name
ORDER BY
    sum(price) desc;
Top Selling items by Day-of-Week
SELECT
    dayofweek(order_ts) as DoW,
    menu_item_name,
    sum(price) AS revenue
FROM
    app.orders
WHERE
    date(order_ts) >= '2022-01-01'
    AND date(order_ts) <= '2022-03-31'
    AND truck_brand_name = 'Guac n'' Roll'
    AND franchise_id = 1
GROUP BY
    dayofweek(order_ts),
    menu_item_name
ORDER BY
    dayofweek(order_ts),
        sum(price) desc;
Best Cities by Day-of-Week
SELECT
    dayofweek(order_ts) as DoW,
    primary_city,
    sum(price) AS revenue
FROM
    app.orders
WHERE
    date(order_ts) >= '2022-01-01'
    AND date(order_ts) <= '2022-03-31'
    AND truck_brand_name = 'Guac n'' Roll'
    AND franchise_id = 1
GROUP BY
    dayofweek(order_ts),
    primary_city
ORDER BY
    dayofweek(order_ts),
    sum(price) desc;
Overview
Now that we've created our database, loaded data and developed the queries needed to answer our business questions the last step before getting into application code is setting up the necessary objects so that the application can connect to Snowflake securely and query data on its own Virtual Warehouse
Setting Snowsight Context
To ensure the correct context is use for these queries we will set our database, schema, and Virtual Warehouse using the following SQL:
-- Set query context
use database frostbyte_tasty_bytes;
use schema app;
use warehouse query_wh;
Step 3.1 Creating the Service User
To enable our application to connect securely to Snowflake we are going to create a service user in the Snowflake account and create a key pair that we will use to authenticate that user. Start by generating a private and a public key to associate with the user.
Generate and download the key files in your browser. Running the following commands below in the Web OpenSSL Application window and download the Files generated.
If you prefer to generate the key files using openssl locally, run the following commands in your shell.
$ openssl genrsa 2048 | openssl pkcs8 -topk8 -inform PEM -out app_user_rsa_key.p8 -nocrypt
Generating RSA private key, 2048 bit long modulus (2 primes)

$ openssl rsa -in app_user_rsa_key.p8 -pubout -out app_user_rsa_key.pub
writing RSA key

$ cat app_user_rsa_key.pub
-----BEGIN PUBLIC KEY-----
MIIBIjANBgkqhkiG9w0BAQEFAAOCAQ8AMIIBCgKCAQEAmT/
....
+SWsODZKAhqU8PRAqlXhIQIDAQAB
-----END PUBLIC KEY-----
You should now have two key files in your folder, app_user_rsa_key.p8 and app_user_rsa_key.pub. We can now create the service user in Snowflake, in the Snowflake account you created in the earlier lab (as ACCOUNTADMIN), run the following:
-- Change role to accountadmin
use role accountadmin;

-- Create a database role for our application
create role tasty_app_api_role;

-- Grant privileges to the newly created role on required database objects
grant usage on database frostbyte_tasty_bytes to role tasty_app_api_role;
grant usage on schema frostbyte_tasty_bytes.app to role tasty_app_api_role;
grant select on all tables in schema frostbyte_tasty_bytes.app to role tasty_app_api_role;
grant select on future tables in schema frostbyte_tasty_bytes.app to role tasty_app_api_role;

-- Create the service user
create user if not exists tasty_app_api_user
    password = null
    login_name = 'tasty_app_api_user'
    display_name = 'tasty app api user'
    first_name = 'tasty app api user'
    last_name = 'tasty app api user'
    must_change_password = false
    disabled = false
    default_warehouse = tasty_app_api_wh
    default_namespace = frostbyte_tasty_bytes.app
    default_role = tasty_app_api_role
    rsa_public_key = '<rsa_public_key>'
    comment = 'api user for tasty app';

-- Grant the role to the user
grant role tasty_app_api_role to user tasty_app_api_user;
Where you replace app_user_rsa_key.pub file you just created locally (copy everything between the -----BEGIN PUBLIC KEY----- and the -----END PUBLIC KEY----- lines)
Step 3.2 Creating a Virtual Warehouse for the Application
Much like we created separate Virtual Warehouses for exploring and loading data, we will create one specifically for our service to use when executing queries on Snowflake. We will also grant the privilege USAGE to the service role so that it can use the warehouse.
-- Create Warehouse for the API
create or replace warehouse tasty_app_api_wh with
    warehouse_size = 'small'
    warehouse_type = 'standard'
    auto_suspend = 300
    auto_resume = true
    min_cluster_count = 1
    max_cluster_count = 1
    scaling_policy = 'standard';

-- Grant permission to use the warehouse to the service role
grant usage on warehouse tasty_app_api_wh to role tasty_app_api_role;
Step 3.3 Building the Users Login table
Since our application will be connecting to Snowflake using a service user, we need a place to store the Franchisee login information and encrypted passwords so the application can authenticate them at login.
-- Create Users table for the Website
create or replace table users (
	user_id number(38,0) autoincrement,
	user_name varchar(16777216) not null,
	hashed_password varchar(16777216),
	franchise_id number(38,0),
	password_date timestamp_ntz(9),
	status boolean,
	unique (user_name)
);
 -- Add Franchisee logins
insert into users
    values
    (1,'user1','$2b$10$v0IoU/pokkiM13e.eayf1u3DkgtIBMGO1uRO2O.mlb2K2cLztV5vy',1,current_timestamp,TRUE),
    (2,'user2','$2b$10$e2TXM/kLlazbH1xl31SeOe6RTyfL3E9mE8sZZsU33AE52rO.u44JC',120,current_timestamp,TRUE),
    (3,'user3','$2b$10$WX4e1LAC.rAabBJV58RuKerEK4T/U4htgXrmedTa5oiGCWIRHwe0e',271,current_timestamp,TRUE);
This lab will take you through building the backend, in the form of an API, that can be called by the frontend application. The backend API will connect to the Snowflake database and serve the results of queries over a number of API endpoints. We will take the queries designed in the Lab 3: Snowflake Setup and have the results of these queries returned by endpoints in the API. We will then secure access to the API using bearer authorization tokens in the form of signed JWTs (Javascript Web Tokens). For this lab we are not securing the communication using HTTPS, but in a production environment this should be added.
Lab 4.1: Setting up the code
The starting code for this lab is hosted on GitHub. You can start by cloning the repository into a separate folder if you haven't done so already as part of the earlier labs.
git clone https://github.com/Snowflake-Labs/sfguide-tasty-bytes-zero-to-app zero-to-app
Change directory to the zero-to-app/ directory that is created when you clone the repository. You should now have a directory with subdirectories for the different labs. For this lab we will use the backend/ directory. Open this directory in an IDE (like VSCode).
We will start by adding the Node dependencies to the project. In a terminal window run the following:
npm i express@4.18.2 snowflake-sdk@1.6.22 dotenv@16.1.3 bcrypt@5.1.0 cors@2.8.5 jsonwebtoken@9.0.0
npm i nodemon@2.0.22 --save-dev
Start the server by running:
npm run serve
This will run the server and you can access the supplied endpoint in a browser, or using curl:
curl http://localhost:3000
Note that this runs the Node server using nodemon, which helps us by restarting the server whenever it detects a change to the code we are working on. However, if you need to stop it, simply press Ctrl + c in the terminal where you started it. Once stopped, if it crashed, or something else happend, you can simply run npm run serve again to start it back up. In several steps below you are asked to do additional tasks in the terminal/shell, easiest is often to open an additional terminal window for these and keeping the server running in the first one.
Lab 4.2: Configuring the connection to Snowflake
We can now connect to the Snowflake database we created in the earlier lab. To do so we are going to use the service user (TASTY_APP_API_USER) in the Snowflake account created in the previous lab. We will need the private key created in Lab 3: Snowflake Setup. If you didn't change the location of where that key was created, we can simply reference it in our code. The path ../../app_user_rsa_key.p8 here is the relative path from app.js file to the folder where the key was created.
The code for setting up the connection to Snowflake is contained in the file connect.js. Add a reference to this file at the top of app.js:
// 4.2.1 Set up the connection to Snowflake
var connection = require('./connect.js')
In connect.js, after starting the server on line 17, add the following:
// 4.2.2 get connection details from environment variables
const options = {
    account: process.env.ACCOUNT,
    username: process.env.USERNAME,
    authenticator: "SNOWFLAKE_JWT",
    privateKeyPath: "../../app_user_rsa_key.p8",
    database: process.env.DATABASE,
    schema: process.env.SCHEMA,
    warehouse: process.env.WAREHOUSE,
};

// 4.2.3 create the connection to the Snowflake account
const connection = snowflake.createConnection(options);
connection.connect((err, conn) => {
    if (err) {
        console.error('Unable to connect to Snowflake', err);
    } else {
        console.log('Connected to Snowflake account ' + options.account);
    }
});

module.exports = connection;
Also create a new file called .env in the backend directory by copying the .env.example file:
cp .env.example .env
Edit the .env file and replace REPLACE_WITH_ACCOUNT with the account identifier of your Snowflake account.
To now test out the connection, start by replacing the / route in the app.js file to use the connection we just created, and issue a query:
app.get("/", (req, res, next) => {
    console.log(req.method + ': ' + req.path);
    // 4.2.3 Connect to Snowflake and return query result
    connection.execute({
        sqlText: sql_queries.all_franchise_names,
        complete: (err, stmt, rows) => {
            if (err) {
                console.error('Unable to retrieve franchises', err);
                res.status(500).json({ error: 'Unable to retrieve franchises' });
            } else {
                res.status(200).json(rows);
            }
        },
    });
});
Here we are executing the SQL command that is defined in the sql.js file. These are the queries that you developed in the previous lab. This file is included in app.js as a requirement at the top of the file:
// 4.2.4 Definition of sql queries to execute
var sql_queries = require('./sql')
Open the sql.js file and examine the SQL statement being executed. Test this out in a browser http://localhost:3000/, or by running a curl command:
curl http://localhost:3000
Lab 4.3: Building the endpoints
We can now add the queries to each endpoint to make them return some more interesting results. Start with the endpoint for getting sales for the top 10 countries. It is contained in the file /routes/franchise.js. Start by including this file in app.js and add the routes we will define in there to the app:
// 4.3.1 Add franchise routes
const franchise = require('./routes/franchise.js')
app.use("/franchise", franchise);
Now we open /routes/franchise.js and update the first route to return the top selling countries for a specified franchise between two dates:
router.get('/:franchise/countries/', (req, res) => {
    // 4.3.2 Parse parameters and connect to Snowflake a return query response
    const franchise = req.params.franchise
    const startdate = utils.parseDate(req.query.start) ?? utils.defaultStartDate();
    const enddate = utils.parseDate(req.query.end) ?? utils.defaultEndDate();

    console.log('start: ' + startdate + ', end: ' + enddate);

    connection.execute({
        sqlText: sql_queries.top_10_countries,
        binds: [franchise, startdate, enddate],
        complete: (err, stmt, rows) => {
            if (err) {
                console.error('Unable to retrieve order data', err);
                res.status(500).json({ error: 'Unable to retrieve order data' });
            } else {
                res.status(200).json(rows);
            }
        },
    });
});
In the code we are using a helper functions from the file utils.js to parse out dates from the supplied query string parameters in the format YYYY-MM-DD.
We are here picking up both the franchise id from the parameters of the request, like http://localhost:3000/franchise/1/countries and optionally allowing the user to specify a start and end date for the data to be returned, like http://localhost:3000/franchise/1/countries?start=2022-01-01&end=2022-03-01. These parameters are then bound to the query using the binds argument to the execute() function call. Updated the SQL statement top_10_countries in the sql.js file to use these parameters in the condition for the query:
-- 4.3.3 Update SQL for Top selling countries for franchise
-- Top 10 Countries
    SELECT
        TOP 10 country,
        sum(price) AS revenue
    FROM
        app.orders
    WHERE
        franchise_id = :1
        AND date(order_ts) >= :2
        AND date(order_ts) <= :3
    GROUP BY
        country
    ORDER BY
        sum(price) desc;
In the query, you can see how each argument (franchise, startdate, enddate) passed to the query gets bound to the ordinal markers (:1, :2, :3).
You can now go ahead and implement the next endpoint /:franchise/trucks/:truckbrandname/sales_topitems in the same way, by getting the parameters from the request and binding them to the executed SQL statements in the section marked 4.3.4. Also update the SQL statement in the sql.js file, using the query built in the first labs. Note that you here will have to also bind the parameter for :truckbrandname to the SQL statement marked 4.3.5.
The routes we will add are:
Route | Method | Query Parameters | |
/ | Return a list of available franchises and the truck brands for each | ||
/franchise/:franchise/countries | Returns a top 10 countries by sales for the specified franchise | startdate and enddate | |
/franchise/:franchise/trucks | Returns a top 10 trucks by sales for the specified franchise | startdate and enddate | |
/franchise/:franchise/revenue/:year | Return the revenue for the specified year and truck | ||
/franchise/:franchise/trucks/:truckbrandname/sales_topitems | Returns the top selling items by truck brand for a specified franchise. | startdate and enddate | |
/franchise/:franchise/trucks/:truckbrandname/sales_dayofweek | Returns sales by truck brand for a specified franchise by day of week. different views of the data is returned | startdate and enddate | |
/franchise/:franchise/trucks/:truckbrandname/sales_topitems_dayofweek | Returns the top selling items by truck brand for a specified franchise by day of week. | startdate and enddate | |
/franchise/:franchise/trucks/:truckbrandname/locations | Returns the top 10 locations for a truck brand for a specified franchise | startdate and enddate | |
The routes can then be filtered by adding ?start=2022-01-01&end=2022-03-01 as optional query parameters.
The code for the remaining endpoints is in the file /routes/franchise_all.js. Also add these routes to the app.js file to include them in the service:
// 4.3.6 Add remaining franchise routes
const franchise_all = require('./routes/franchise_all.js')
app.use("/franchise", franchise_all);
With this, all the endpoints are now built out and you can test the API.
Here are a few curl commands to test the APIs:
curl "http://localhost:3000/franchise/120/countries"curl "http://localhost:3000/franchise/120/trucks"curl "http://localhost:3000/franchise/120/revenue/2022"curl "http://localhost:3000/franchise/120/trucks/Guac%20n%27%20Roll/sales"curl "http://localhost:3000/franchise/120/trucks/Guac%20n%27%20Roll/sales?analysis=dayofweek"curl "http://localhost:3000/franchise/120/trucks/Guac%20n%27%20Roll/sales?analysis=topitems_dayofweek"
Lab 4.4: Securing the API
We should now add a way to secure the access to the API, so that the frontend that we will build in a later lab, can authenticate and we can manage the access to the data and the endpoints. For this API we will use a HTTP authentication scheme usually referred to as Bearer Authentication. An application, like the frontend, can login using a username and password, and get a signed token back from the backend that in subsequent calls can be included in the header. The token will be signed by the backend so that in later calls the signature can be verified, adding a measure of protection against tampering. It should be noted that in this lab we are not setting up secured communication with HTTPS, but in a production scenario, this should be done to ensure that both username and passwords, as well as tokens sent between backend and frontend, are protected from interception. The very nature of bearer tokens means that anyone in possession of (bearing) a valid token will be given access to the protected resource (hence the name bearer). For this lab we will be using signed JWTs (JSON Web Token), which is a common standard for token authentication.
Creating access tokens
We will start by generating two random secrets that should be secured with the backend and not shared with other parties. We will use the node command-line tool to do this.
$ node
> require("crypto").randomBytes(64).toString("hex")
'0b5191c5f9257c3999d1c7d1324e66f6af9a187881b52e2a4117afe6c7f901329e0a6bb1bebc5d5ea9e6a98984e288f12bb29950b77c4d98075dba87bdb6c5bb'
> require("crypto").randomBytes(64).toString("hex")
'b8f994547e66fa6cecf3e02ab35275616d900368fe0ca2ac6bf4342ff63abef7d093d6f4d6c574f7d44ee30ea54f6716c6f1c5bef23e61ab9888fccb061ba9f4'
> .exit
Generate two random strings like this and add them in the .env file.
ACCESS_TOKEN_SECRET=0b5191c5.....dba87bdb6c5bb # 4.4.1 Replace with randomly generated string
REFRESH_TOKEN_SECRET=b8f99454.....fccb061ba9f4 # 4.4.1 Replace with randomly generated string
The provided code in the auth.js file helps us create access and refresh tokens:
const jwt = require("jsonwebtoken")
module.exports = {

    refreshTokens: [],

    // accessTokens
    generateAccessToken: function(user) {
        return jwt.sign(user, process.env.ACCESS_TOKEN_SECRET, { expiresIn: "360m" })
    },

    // refreshTokens
    generateRefreshToken: function(user) {
        const refreshToken =
            jwt.sign(user, process.env.REFRESH_TOKEN_SECRET, { expiresIn: "20m" })
        this.refreshTokens.push(refreshToken)
        return refreshToken
    },
};
Include the auth.js at the top of the app.js file:
// 4.4.2 Add helpers for authenetication and tokens
var auth = require('./auth')
Notice how the ACCESS_TOKEN_SECRET and REFRESH_TOKEN_SECRET from the .env file are now used to sign the tokens we generate. Having different secrets means that this back backend can uniquely verify that a token was generated and signed by itself.
Adding a login endpoint to the API
In /routes/login.js we can now add two endpoints; one to login and get an access token, and one to get a refresh token. We will check the supplied username and password with the hashed password in our database in the USERS table. Additionally, we will add an endpoint to get a new access token using the refresh token, in case the access token has expired.
app.post("/login", async (req, res) => {
    if(!req.body.name || !req.body.password ) {
        res.status(422).send("Incorrect data")
        return
    }

    const login_user = req.body.name
    const login_password = req.body.password
    connection.execute({
        sqlText: sql_queries.verify_user,
        binds: [login_user],
        complete: (err, stmt, rows) => {
            if (err) {
                console.error('Unable to validate user', err);
                res.status(500).json({ error: 'Unable to validate user' })
                return
            } else {
                if (rows.length == 0){
                    console.log('User does not exist: ' + login_user)
                    res.status(401).json('Invalid user or password')
                    return
                } else {
                    user_row = rows[0]
                    user_name = user_row.USER_NAME
                    hashed_password = user_row.HASHED_PASSWORD
                    franchise_id = user_row.FRANCHISE_ID
                    bcrypt.compare(login_password, hashed_password, function(err, result) {
                        if (err){
                            console.log('Failed to check password for: ' + login_user + ' - ' + err.message)
                            res.status(401).json('Invalid user or password')
                            return
                        }
                        if (result){
                            console.log('Successful login, generating token for: ' + user_name + ', franchise: ' + franchise_id)
                            const accessToken = auth.generateAccessToken({ user: req.body.name, franchise: franchise_id })
                            const refreshToken = auth.generateRefreshToken({ user: req.body.name, franchise: franchise_id })
                            res.json({ accessToken: accessToken, refreshToken: refreshToken })
                            return
                        }
                        console.log('Incorrect password for user: ' + login_user)
                        res.status(401).json('Invalid user or password')
                        return
                    });
                }
            }
        },
    });
});

app.post("/refresh", (req, res) => {
    if (!req.body.token)
        res.status(422).send("Incorrect data")
    if (!auth.refreshTokens.includes(req.body.token))
        res.status(400).send("Refresh Token Invalid")
    auth.refreshTokens = auth.refreshTokens.filter((c) => c != req.body.token)
    //remove the old refreshToken from the refreshTokens list
    const accessToken = auth.generateAccessToken({ user: req.body.token.user, franchise: req.body.token.franchise })
    const refreshToken = auth.generateRefreshToken({ user: req.body.token.user, franchise: req.body.token.franchise })
    //generate new accessToken and refreshTokens
    res.json({ accessToken: accessToken, refreshToken: refreshToken })
});
You can now add these two endpoints to the API by including it in app.js:
// 4.4.3 Add routes for login
app.use("/", login);
Since we already created users in the first lab and stored hashed passwords for them in the database, we can try out the login endpoint to get an access token:
curl -X POST http://localhost:3000/login -H 'Content-Type:application/json' -d '{"name":"user2","password":"password120"}'
You can inspect the content of the JWT tokens using JWT.io, paste it in and inspect the payload. It should contain something like this in the payload part:
{
  "user": "user2",
  "franchise": "120",
  "iat": 1681417090,
  "exp": 1681418290
}
Just for reference, the users that were created in the earlier database set up lab are the following:
User name | Hashed password | Franchise id | Plaintext password |
user1 | $2b$10$3/teX....iH7NI1SjoTjhi74a | 1 | password1 |
user2 | $2b$10$9wdGi....U8qeK/nX3c9HV8VW | 120 | password120 |
user3 | $2b$10$CNZif....IXZFepwrGtZbGqIO | 271 | password271 |
Validating tokens
We can now add a validation of the token that should now be included in each call to the backend by adding a middleware to the routes.
In auth.js we have a method to validate a token, meaning that the backen can look at a supplied token and verify that is was actually signed using the same secret we generated earlier.
    validateToken: function (req, res, next) {
        ..
        jwt.verify(token, process.env.ACCESS_TOKEN_SECRET, (err, user) => {
            if (err) {
                res.status(403).send("Token invalid")
            }
            else {
                req.user = user
                next() //proceed to the next action in the calling function
            }
        });
    },
This function can now be added as route middleware (meaning they will be executed as part of the request/response chain), to app.js like this:
// 4.4.4 Add validation of tokens to each route
app.use(auth.validateToken);
This validates the JWT token and picks up the user and franchise that should be set in it, we can now access the data in the req.user variable in our endpoints.
It's important that this is actually added after the route for /login, otherwise it will actually try to validate the token as you are trying to login to get a token (creating an impossible situation). In Node Express the order in which we add routes and middleware is important to keep track of.
In auth.js we also have a method to validate that the user has access to the franchise that is requested in the route, meaning that if you log in with a user with a franchise_id we simply verify that you in the queries are trying to access that franchise (if not we will throw back an Unauthorized status for the request) :
    validateAccess: function (req, res, next) {
        if (req.user && req.user.franchise) {
            const franchise = req.params.franchise
            if (franchise == req.user.franchise) {
                res.franchise = req.user.franchise
                next()
            } else if (franchise == undefined) {
                next()
            }
            else {
                res.status(403).json({ error: 'Unauthorized' })
            }
        }
        else {
            res.status(403).json({ error: 'Unauthorized' });
        }
    }
Now go ahead and add this to each endpoint in /routes/franchise.js:
router.get('/:franchise/countries/', auth.validateToken, (req, res) => {
    // 4.3.2 Parse parameters and connect to Snowflake a return query response

    ...
});
Test this out by calling an endpoint, using curl and supplying the access token we got earlier when testing the login endpoint:
curl http://localhost:3000/ -H "Accept: application/json" -H "Authorization: Bearer eyJhbGciOiJIUzI1....ceiHArwUcaA8"
Lab 4.5 Adding CORS to the API
Since the frontend will be calling the backend from another host, we need to add allowed origins for requests to the backend.
In the development of this lab we are using localhost:3000 for the backend and localhost:3001 for the frontend, when deployed they would have some different hostnames.
For security reasons, browsers restrict cross-origin HTTP requests initiated from scripts, meaning that if we don't explicitly allow another origin, like localhost:3001 to request a resource from our API it will be blocked.
We solve this in Node Express by adding the cors package to the application and then configuring the allowed origins.
Right before we start the server in app.js, add the following to allow CORS (Cross Origin Request Scripting) for the frontend that we will later build:
// 4.5.1 add CORS to the app
cors_origin = 'http://localhost:3001'
app.use(cors({
    origin: [cors_origin]
}));
Lab 4.6 Finalizing the API
The backend is now ready to be used by the frontend. We can do some final updates to the API to make it easier to manage and making it a little more flexible.
First, we move all configuration in app.js to an environment file. This will help us when are deploying it somwhere else. Replace the old code for cors_origin and all the way to the call for app.listen(...) with this:
// 4.5.1 add CORS to the app
cors_origin = process.env.CORS_ADDRESS ?? 'http://localhost:3001'
app.use(cors({
    origin: [cors_origin]
}));

port = process.env.PORT ?? 3000
app.listen(port, () => {
    console.log('Server running on port ' + port);
    console.log('Environment: ' + app.get('env'))
    console.log('CORS origin allowed: ' + cors_origin)
});
Since we may want to test out the API, without having to add a bearer token to the request header (which is not possible with a regular browser window), we can add a simple way to bypass the validation. We only allow this when the API is running in development mode however.
To enable this, we can add a NODE_ENV variable to our .env file. If that is set to development then we will bypass the token validation and use a preset user and franchise (DEV_AUTH_USER and DEV_AUTH_FRANCHISE variables, also in the .env file). This is great for testing and development, but should of course not be present in the production deployment of the API.
Add these 3 variables to your .env file. The final .env file would then look like this:
ACCOUNT=my_account_123
USERNAME=tasty_app_api_user
DATABASE=FROSTBYTE_TASTY_BYTES
SCHEMA=RAW_POS
WAREHOUSE=TASTY_DATA_APP_WH

ACCESS_TOKEN_SECRET=0b5191c5f9257c3999d1c7d1324e66f6af9a187881b52e2a4117afe6c7f901329e0a6ba1bebc5d5ea9e6a98984e288f12bb29950b77c4d98075dba87bdb6c5bb
REFRESH_TOKEN_SECRET=b8f994547e66fa6cecf3e02ab35275616d900368fe0ca2ac6bf4342ff63abef7d093d6f4d6e574f7d44ee30ea54f6716c6f1c5bef23e61ab9888fccb061ba9f4

PORT=3000
CORS_ADDRESS=http://localhost:3001
NODE_ENV=development
DEV_AUTH_USER=user1
DEV_AUTH_FRANCHISE=1
Next, in the auth.js file we can update the validateToken function:
    validateToken: function (req, res, next) {
        //get token from request header
        const authHeader = req.headers["authorization"]
        if (authHeader == null) {
            // 4.6.2 Allow for development mode bypass of token validation
            environment = process.env.NODE_ENV
            if('development'==environment){
                if (process.env.DEV_AUTH_USER){
                    console.warn('Development mode: no auth header found, accepting user "' + process.env.DEV_AUTH_USER + '" from environment variables with franchise ' + process.env.DEV_AUTH_FRANCHISE)
                    req.user = {user:process.env.DEV_AUTH_USER, franchise:process.env.DEV_AUTH_FRANCHISE}
                    next()
                    return
                }
            }
            res.status(400).send("Auth header not present")
            return
        }
        const token = authHeader.split(" ")[1]
        //the request header contains the token "Bearer <token>", split the string and use the second value in the split array.
        if (token == null) res.status(400).send("Token not present")
        jwt.verify(token, process.env.ACCESS_TOKEN_SECRET, (err, user) => {
            if (err) {
                res.status(403).send("Token invalid")
            }
            else {
                req.user = user
                next()
            }
        });
    },
Overview
In this lab we want to test the scalability of the API. We want to ensure that when the workload increases, Snowflake scales out to meet that need. To test this we are going to run the same stress test against our API twice. The first time we run the test will be with a single cluster warehouse (as it is now, min and a max size are both set to 1). The second time we run the test will be with a multi-cluster warehouse (MCW)
For the tests we are going to be using artillery.io
In order to use artillery we will need to install it. Make sure you are in the backend directory of the project and on the command line execute the following statement.
npm install -g artillery
Conduct the test (single cluster warehouse)
To run our test we need to define what that test looks like. This definition is the same for both tests so we compare apples and apples. In our project we go to the /backend/load_test directory and find the load_test.yaml file which describes the test we are about to perform
config:
  target: "http://localhost:3000"
  http:
      # Responses have to be sent within 180 seconds, or an `ETIMEDOUT` error gets raised.
      timeout: 180
  processor: "./load_test/load_test_helper.js"
  phases:
    - duration: 100
      arrivalRate: 10
      rampTo: 50

scenarios:
  - name: "Get basic data"
    flow:
      - post:
          url: "/login"
          json:
            name: "user2"
            password: "password120"
          capture:
           - json: "$.accessToken"
             as: "accessToken"
      - loop:
          - function: "generateRandomDate"
          - get:
              url: "/franchise/120/countries?start={{ startDate }}&end={{ endDate }}"
              headers:
                Authorization: "Bearer {{ accessToken }}"
              afterResponse: "printStatus"
          - think: 1
        count: 5
- config
- target: The API url we are targetting
- arrivalRate: new users to add every second
- scenarios
- flow.post.url: endpoint we hit using (POST)
- flow.post.json.name: pass in the username
- flow.post.json.password: pass in the password
- flow.post.capture.json: capture the returned access token
- loop: we are going to execute the next step a number of times
- loop.get.url: endpoint we hit using (GET)
- loop.get.headers.Authorization: pass in the authorization header using the token retrieved earlier
Run the Test
Now let's go ahead and run the test. Before we do let's capture the current_timestamp so we can use it in your queries later and make filtering really easy. Grab the return from the following statement
SELECT current_timestamp();
from the backend directory of the project go ahead and execute the following
npx artillery run ./load_test/load_test.yaml
Test Completed
Our test is complete and we have two outputs to look at. One is on your screen from Artillery. It is telling you things like the number of requests issued, the rate we issued queries, the result codes and how many vUsers were created.
The other way to look at this is inside Snowflake. We want to see if the warehouse scaled out and executed queries on those scaled out clusters. Let's first look from the perspective of the warehouse. In Snowsight run the following query the filters by the warehouse name and suitable duration in the past. In this test there should be no rows returned
SELECT * FROM SNOWFLAKE.ACCOUNT_USAGE.WAREHOUSE_EVENTS_HISTORY
WHERE CLUSTER_NUMBER > 0
AND WAREHOUSE_NAME = 'TASTY_APP_API_WH'
AND TIMESTAMP >= '<insert value we captured earlier>'
ORDER BY TIMESTAMP DESC;
The other persective is from the perspective of the queries we executed. For that we can run the following query in Snowsight that again filters by the warehouse and timeframe. What did those wait times look like? There are other metrics available in the QUERY_HISTORY view that are not included below for brevity but if you are feeling curious then you can add them to the query also.
SELECT
    Query_ID,
    start_time,
    end_time,
    total_elapsed_time,
    EXECUTION_TIME,
    queued_overload_time,
    queued_overload_time + execution_time as how_the_times_add_up,
    cluster_number,
    warehouse_name,
    execution_status,
    QUEUED_PROVISIONING_TIME,
    queued_repair_time,
    child_queries_wait_time
FROM SNOWFLAKE.ACCOUNT_USAGE.QUERY_HISTORY
WHERE warehouse_name = 'TASTY_APP_API_WH'
AND start_time >= '<insert value we captured earlier>'
ORDER BY start_time DESC;
Now let's change the warehouse into a MCW and rerun the test. In Snowsight execute the following.
ALTER WAREHOUSE <insert name of your warehouse> SET MAX_CLUSTER_COUNT = 10;
In the code above we will allow Snowflake to scale out our warehouse to 10 clusters.
Conduct the tests (Multi-Cluster Warehouse)
Now let's go ahead and run the test again. Before we do let's capture the current_timestamp once more so we can use it in your queries later and make filtering really easy. Grab the return from the following statement
SELECT current_timestamp();
from the backend directory of the project go ahead and execute the following
npx artillery run load_test.yaml
Test Completed
Our test is complete and we again have two outputs to look at. One is on the screen from Artillery. Can you see a difference in the output?
The other is inside Snowflake. We want to see if the warehouse scaled out and executed queries on those scaled out clusters. Let's first look from the perspective of the warehouse. In Snowsight run the following query that filters by the warehouse name and suitable duration in the past. If the warehouse scaled then we should see rows returned:
SELECT * FROM SNOWFLAKE.ACCOUNT_USAGE.WAREHOUSE_EVENTS_HISTORY
WHERE CLUSTER_NUMBER > 0
AND WAREHOUSE_NAME = 'TASTY_APP_API_WH'
AND TIMESTAMP >= '<insert value we captured earlier>'
ORDER BY TIMESTAMP DESC;
and the other persective is from the perspective of the queries we executed. For that we can run the following query in Snowsight that again filters by the warehouse and timeframe and also looks for cluster numbers > 1 (i.e. scale out clusters)
SELECT
    Query_ID,
    start_time,
    end_time,
    total_elapsed_time,
    EXECUTION_TIME,
    queued_overload_time,
    queued_overload_time + execution_time as how_the_times_add_up,
    cluster_number,
    warehouse_name,
    execution_status,
    QUEUED_PROVISIONING_TIME,
    queued_repair_time,
    child_queries_wait_time
FROM SNOWFLAKE.ACCOUNT_USAGE.QUERY_HISTORY
WHERE warehouse_name = 'TASTY_APP_API_WH'
AND cluster_number > 1
AND start_time >= '<insert value we captured earlier>'
ORDER BY start_time DESC;
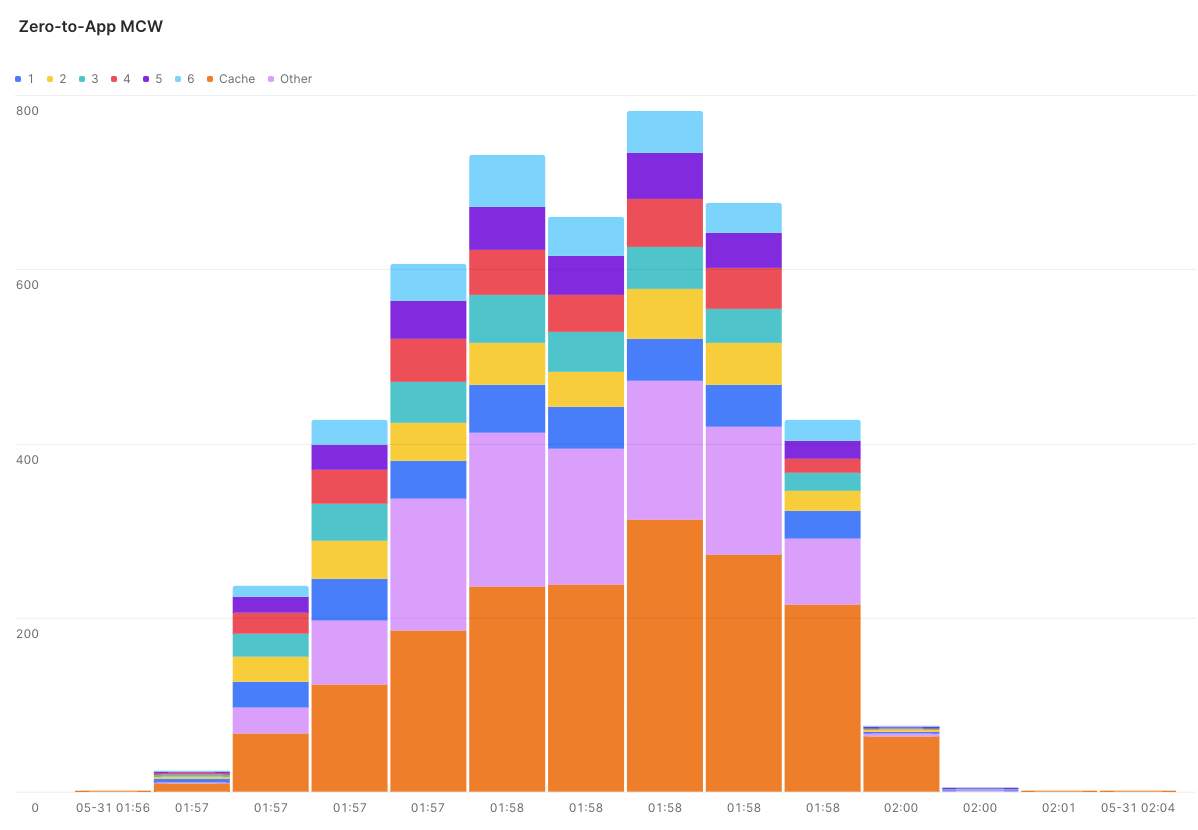
Here is an example test result
--Capture output before test starts
SELECT current_timestamp();
SET load_test_start_time = '<captured value>';-- i.e 2023-05-30 08:31:03.502 -0700

--Capture output after test finishes
SELECT current_timestamp();
SET load_test_end_time = '<captured value>';-- i.e 2023-05-30 08:33:03.502 -0700

--Now execute the following
WITH query_times AS (
    SELECT
        Query_ID,
        CASE WHEN cluster_number IS NULL THEN 'Cache' ELSE cluster_number::varchar END as cluster_number,
        time_slice(start_time::timestamp,10,'SECOND') as slice
    FROM SNOWFLAKE.ACCOUNT_USAGE.QUERY_HISTORY
    WHERE warehouse_name = 'TASTY_APP_API_WH'
    AND start_time >= $load_test_start_time
    AND start_time <= $load_test_end_time
)
SELECT
    count(query_id) as query_count,
    cluster_number,
    slice
FROM query_times
group by cluster_number, slice
ORDER BY slice DESC;
They say a picture paints a thousand words so here is a graph from Snowsight that shows the cluster scale throughout the test.
This lab will take you through building a React JS frontend that can then be displayed in your favorite browser. The frontend will connect to the backend API which then connects to the Snowflake database and serves the results of queries over a number of API endpoints. The query results are then rendered in the browser as charts which are then easily consumed by the end users.
We will take the API Endpoints designed in the Data API Lab and display charts on the web page.
In this lab we are not securing the communication using HTTPS, but in a production environment this should be added.
Lab 6.1: Setting up the code
The starting code for this lab is in the GitHub repository we cloned earlier. For this lab we will use the frontend subdirectory from the main directory. Open this folder in an IDE (like VSCode).
We will start by adding the Node dependencies to the project. In a new terminal window, change to the frontend directory and run the following:
npm i react
npm i react-bootstrap
npm i recharts
To configure the application, copy the example file .env.example to create a new file in the frontend directory called .env
cp .env.example .env
Start the server by running:
npm start
This will start a development web server and you can access the web application in a browser:
http://localhost:3001/
To stop the Web Server, simply terminate the task that started the server, press Ctrl+c
Lab 6.2: Code layout.
Before making changes, let us understand how the files are organized. Below image show various files in building the Frontend. Some of the files contain the boilerplate code generated when initializing ReactJS appilication.
All the required files are in the src folder. src/pages folder has the Javascript (.js) and Stylesheet files (.css)
- Login.js, has the HTML and JS code required to render Login page.
- Login.css, has the styles on the Login Page.
- Home.js, has the HTML and JS code required to render Franchise view. We will be modifying this file to add various charts.
- Home.css, has the styles on the Franchise view.
- Details.js, has the HTML and JS code required to render Truck Detail view. We will be modifying this file to add various charts.
- Details.css, has the styles on the Truck Detail view.
Lab 6.3: Building the Franchise Overview UI.
Login to the website using one of the users and passwords from above.
On successful Login, the Backend API returns Franchise_Id and AccessToken, we will use them to make subsequent calls to the Backend API.
We can now start building the UI. Let us start with building a Bar Chart for the Sales for the Top 10 Countries. The Backend API end point is /franchise/:franchise/countries, optionally specifying the Start and End dates.
First, let us fetch Data from Backend for Sales by Top10 Countries. Update the stubbed method in pages/Home.js add a variable to hold the data returned by the backend as 6.3.1.
let [top10Countries, setTop10Countries] = useState([]);
add the following code to pages/Home.js as 6.3.2.
function fetchTop10Countries() {
    const requestOptions = {
        method: 'GET',
        headers: { 'Content-Type': 'application/json', 'Authorization': 'Bearer ' + location.state.accessToken },
    };
    fetch(backendURL+'/franchise/'+franchise+'/countries?start='+fromDate+'&end='+toDate, requestOptions)
        .then((result) => result.json())
            .then((data) => {
                setTop10Countries(data)
    })
}
We are using the franchise and the accessToken we recieved from the Backend API on successful Login. The accessToken is then validated by the Backend API and the Snowflake query is executed and the results are returned. We convert the results to JSON and store in a local variable.
In the requestOptions, we are setting the Request Method (GET/POST), and we are sending the accessToken in the header as a Bearer Token.
We need to update the React UI hooks, so the newly created method is called when the page is requested. Update the useEffect() method in pages/Home.js as 6.3.3, to add the following.
fetchTop10Countries();
Now that we have the data from the Backend API, we can build the BarChart, to do that, we are using a react library recharts. Add the following code to pages/Home.js as 6.3.4 to display the chart.
<ResponsiveContainer width="100%" height="100%">
    <BarChart
        layout='vertical'
        width={700}
        height={0}
        data={top10Countries}
        margin={{top: 15, right: 15, left: 25, bottom: 5,}}>
        <XAxis type="number" dataKey="REVENUE" tickFormatter={tickFormater}>
        </XAxis>
        <YAxis type="category" dataKey="COUNTRY">
        </YAxis>
        <Tooltip formatter={(value) => 'US$'+(new Intl.NumberFormat('en').format(value))} />
        <Bar dataKey="REVENUE" fill="#548bf2">
            <LabelList dataKey="REVENUE" position="insideRight" fill='white' formatter={labelFormatter} />
        </Bar>
    </BarChart>
</ResponsiveContainer>
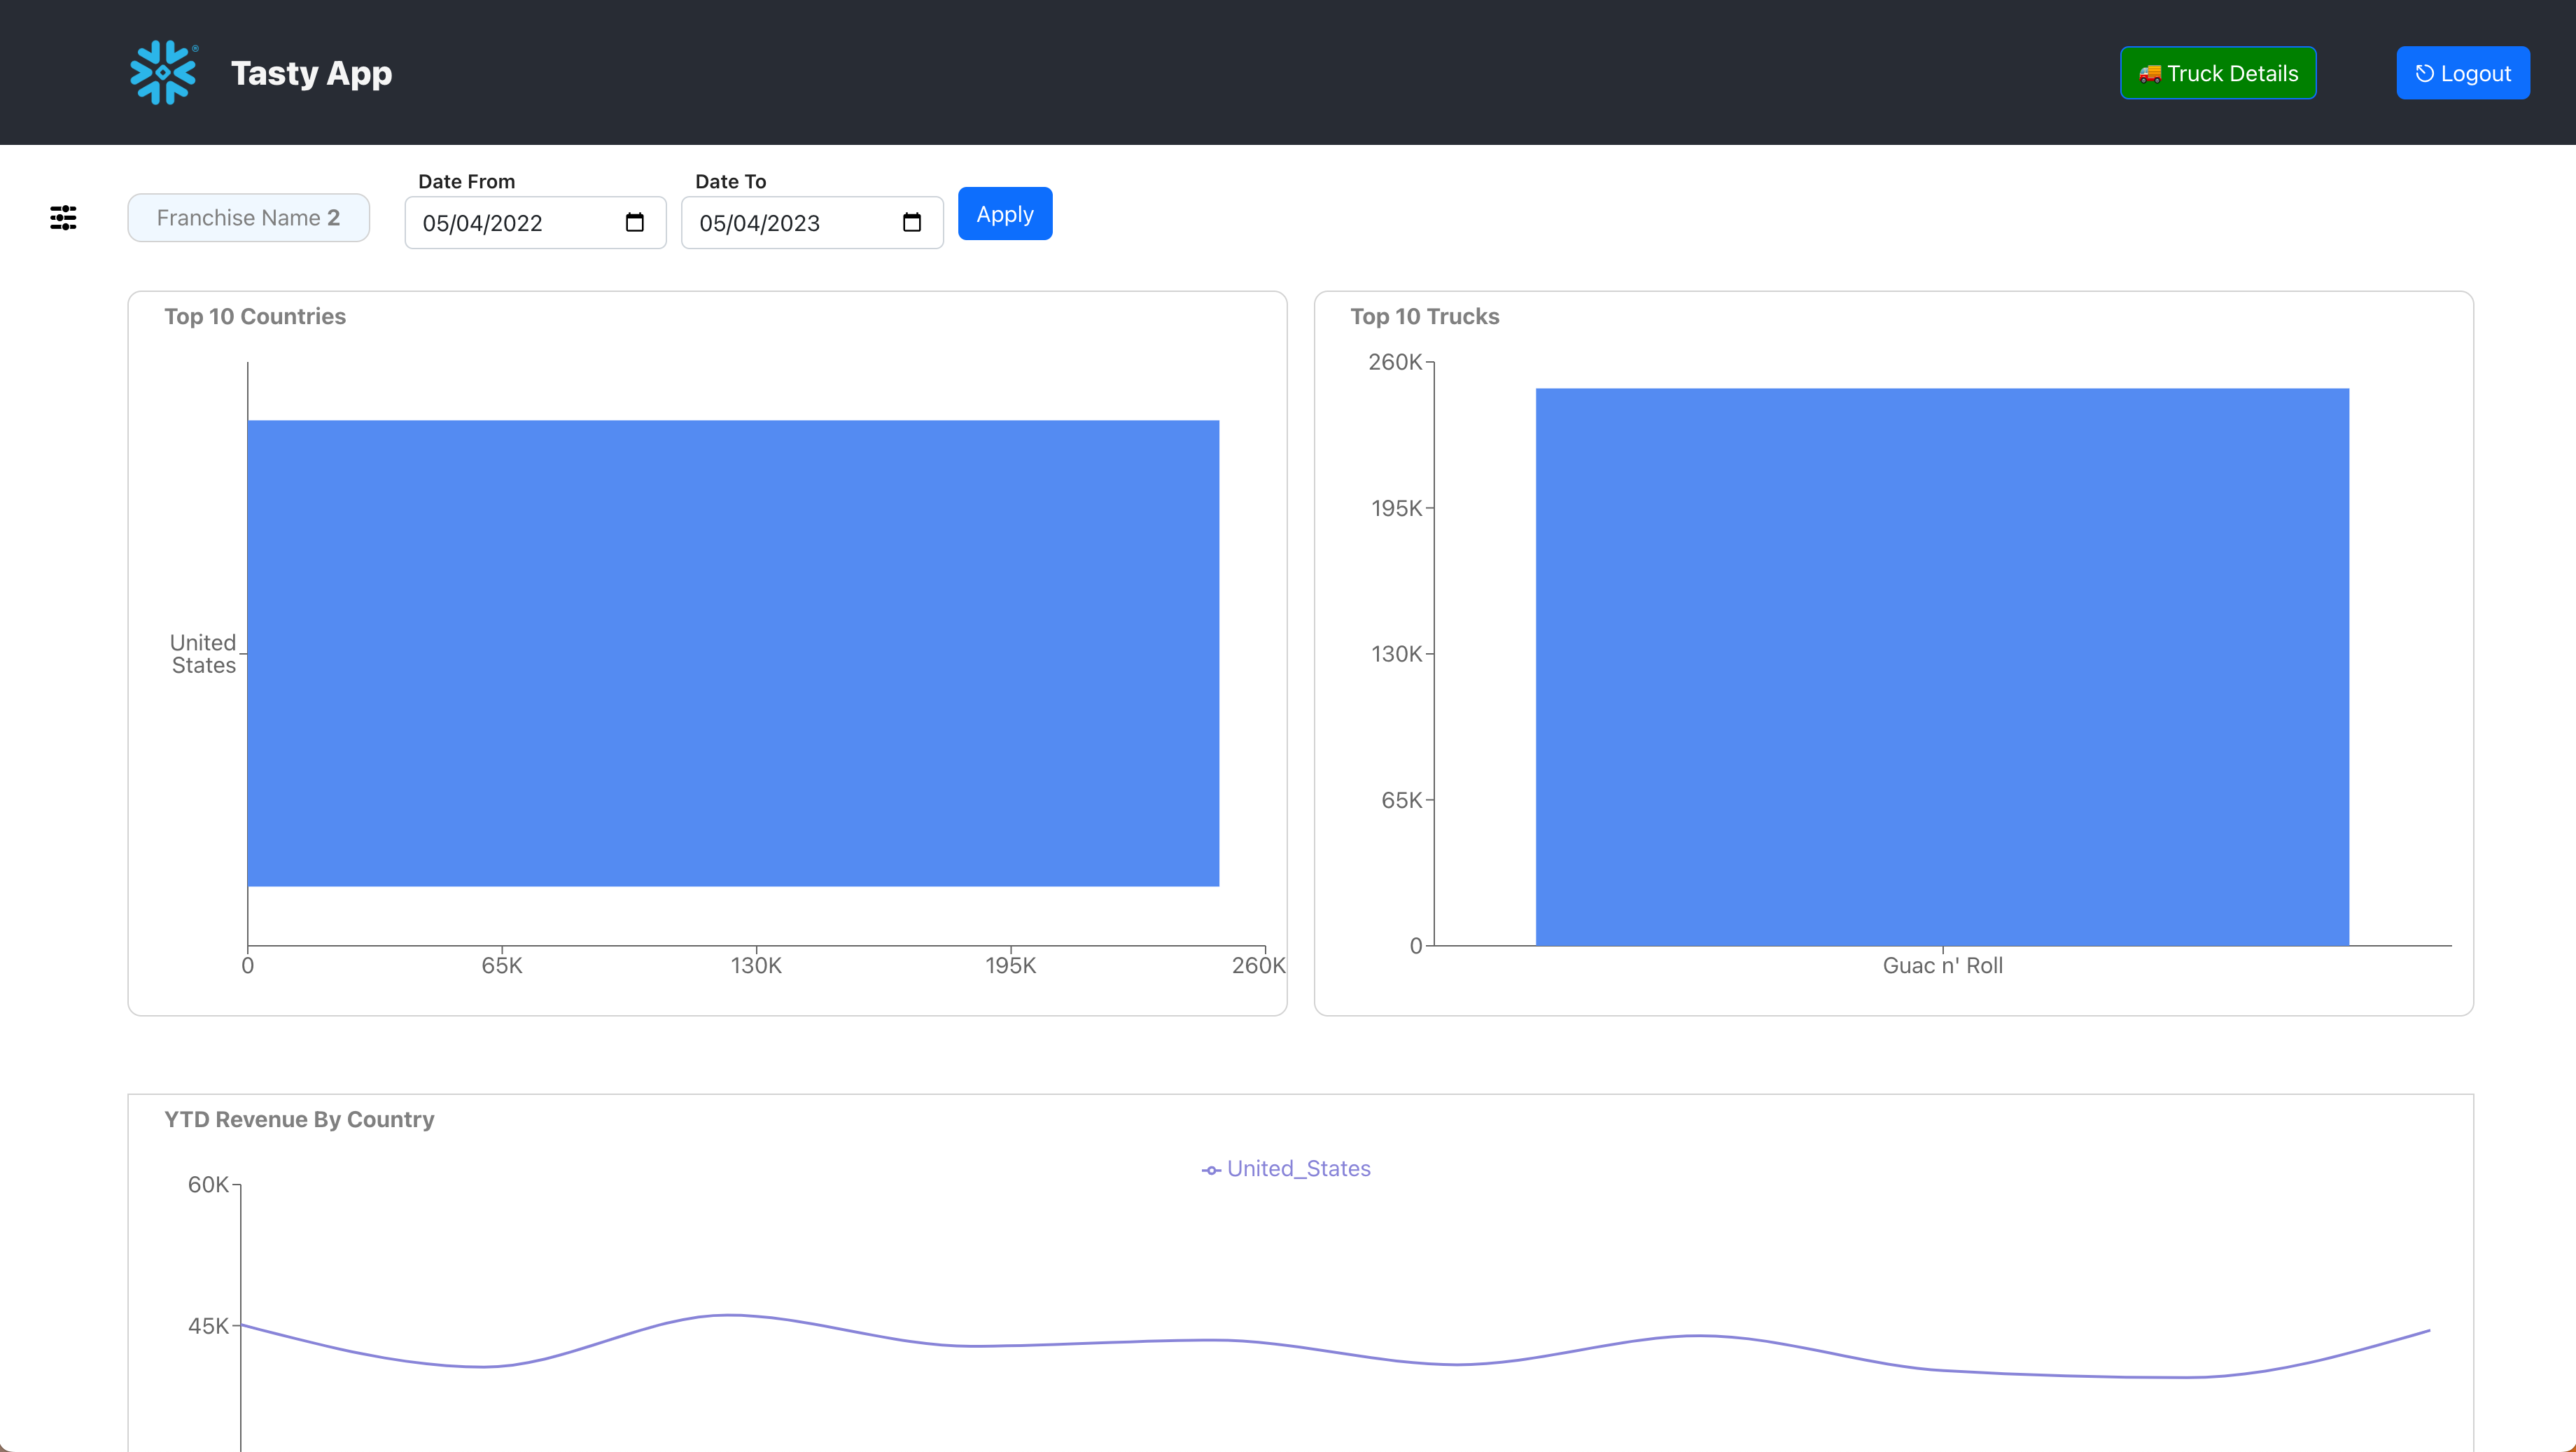
At this point, if you save your changes and check the web browser it should display the Sales for the Top 10 Countries. Make Sure your development Web Server is still running.
Now uet us add a Bar Chart for the Sales for the Top 10 Trucks. The Backend API end point is /franchise/:franchise/trucks, optionally specifying the Start and End dates.
Let us fetch Data from Backend for Sales by Top10 Trucks. In this method, since we are fetching Top Trucks, we will add a little bit of complexity to store unique list of Trucks. Update the stubbed method in pages/Home.js add a variable to hold the data returned by the backend as 6.3.5.
let [top10Trucks, setTop10Trucks] = useState([]); //used to hold Sales of the Top 10 Trucks
let [trucks, setTrucks] = useState([]); // used to hold unique Trucks brands.
add the following code to pages/Home.js as 6.3.6.
function fetchTop10Trucks() {
    const requestOptions = {
            method: 'GET',
            headers: { 'Content-Type': 'application/json', 'Authorization': 'Bearer ' + location.state.accessToken },
    };
    fetch(backendURL+'/franchise/'+franchise+'/trucks?start='+fromDate+'&end='+toDate, requestOptions)
        .then((result) => result.json())
            .then((data) => {
                setTop10Trucks(data)
                let t = [];

                for (let i=0; i<data.length; i++) {
                    t.push(data[i].TRUCK_BRAND_NAME);
                }
                setTrucks(t);
        })
}
We are using the franchise and the accessToken we recieved from the Backend API on successful Login. The accessToken is then validated by the Backend API and the Snowflake query is executed and the results are returned. We convert the results to JSON and store in a local variable.
In the requestOptions, we are setting the Request Method (GET/POST), and we are sending the accessToken in the header as a Bearer Token.
Update the useEffect() method in pages/Home.js as 6.3.7, to add the following.
fetchTop10Trucks();
Now that we have the data from the Backend API, we can build the BarChart, to do that, we are using a react library recharts. Add the following code to pages/Home.js as 6.3.8 to display the chart.
<ResponsiveContainer width="100%" height="100%">
    <BarChart
        layout='horizontal'
        width={700}
        height={0}
        data={top10Trucks}
        margin={{top: 15, right: 15, left: 25, bottom: 5,}}>
        <XAxis type="category" dataKey="TRUCK_BRAND_NAME" />
        <YAxis type="number" dataKey="REVENUE"  tickFormatter={tickFormater} />
        <Tooltip formatter={(value) => 'US$'+(new Intl.NumberFormat('en').format(value))} />
        <Bar dataKey="REVENUE" fill="#548bf2">
            <LabelList dataKey="REVENUE" position="top" fill='grey' formatter={labelFormatter} />
        </Bar>
    </BarChart>
</ResponsiveContainer>
Save your changes and you should see the below chart displayed in your browser running the Web Application.
The final step to finish the page is to add the navigation to go to the Truck Details page, add the following code to pages/Home.js as 6.3.9:
function gotoDetails() {
    navigate('/details', {state: {franchise: franchise, truck_brand_name: top10Trucks[0]['TRUCK_BRAND_NAME'], fromDate: fromDate, toDate:toDate, trucks: trucks, accessToken: location.state.accessToken, refreshToken: location.state.refreshToken}});
}
Lab 6.4: Building the Truck Details Page UI.
We can now start building the Truck details page UI. Let us start with building a Bar Chart for the Best Items for a Truck. The Backend API end point is /franchise/:franchise/trucks/:truck/sales_topitems, optionally specifying the Start and End dates.
First, let us fetch Data from Backend for Best Items for a Truck. Update the stubbed method in pages/Details.js add a variable to hold the data returned by the backend as 6.4.1.
let [topItemsByTruck, setTopItemsByTruck] = useState([]);
add the following code to pages/Details.js as 6.4.2
function fetchTopItemsByTruck() {
        const requestOptions = {
            method: 'GET',
            headers: { 'Content-Type': 'application/json', 'Authorization': 'Bearer ' + location.state.accessToken },
        };
        fetch(backendURL+'/franchise/'+franchise+'/trucks/'+truck+'/sales_topitems?start='+fromDate+'&end='+toDate, requestOptions)
            .then((result) => result.json())
                .then((data) => {
                    setTopItemsByTruck(data)
        })
    }
We are using the franchise and the accessToken we recieved from the Backend API on successful Login. The accessToken is then validated by the Backend API and the Snowflake query is executed and the results are returned. We convert the results to JSON and store in a local variable.
In the requestOptions, we are setting the Request Method (GET/POST), and we are sending the accessToken in the header as a Bearer Token.
Now let us update the React UI hooks, so the newly created method is called when the page is requested. Update the useEffect() method in pages/Details.js as 6.4.3, to add the following.
fetchTopItemsByTruck();
Now that we have the data from the Backend API, we can build the BarChart, to do that, we are using a react library recharts. Add the following code to pages/Details.js as 6.4.4 to display the chart.
<ResponsiveContainer width="100%" height="100%">
    <BarChart
        width={700}
        height={0}
        data={topItemsByTruck}
        margin={{top: 15, right: 15, left: 25, bottom: 5,}}>
        <XAxis type="category" dataKey="MENU_ITEM_NAME">
        </XAxis>
        <YAxis type="number" dataKey="REVENUE" tickFormatter={tickFormater}>
        </YAxis>
        <Tooltip formatter={(value) => 'US$'+(new Intl.NumberFormat('en').format(value))} />
        <Bar dataKey="REVENUE" fill="#548bf2">
            <LabelList dataKey="REVENUE" position="top" fill='grey' formatter={labelFormatter} />
        </Bar>
    </BarChart>
</ResponsiveContainer>
At this point, if you save your changes and check the web browser it should display the Best Items for a Truck. Make Sure your development Web Server is still running.
Now uet us add a Bar Chart for the Sales for day of the week for a truck. The Backend API end point is /franchise/:franchise/trucks/:truck/sales_dayofweek, optionally specifying the Start and End dates.
Let us fetch Data from Backend for Sales for day of the week for a truck. Update the stubbed method in pages/Details.js add a variable to hold the data returned by the backend as 6.4.5.
let [salesByDOW, setSalesByDOW] = useState([]);
add the following code to pages/Details.js as 6.4.6
function fetchSalesByDOW() {
    const requestOptions = {
        method: 'GET',
        headers: { 'Content-Type': 'application/json', 'Authorization': 'Bearer ' + location.state.accessToken },
    };
    fetch(backendURL+'/franchise/'+franchise+'/trucks/'+truck+'/sales_dayofweek?start='+fromDate+'&end='+toDate, requestOptions)
        .then((result) => result.json())
            .then((data) => {
                setSalesByDOW(data)
    })
}
We are using the franchise and the accessToken we recieved from the Backend API on successful Login. The accessToken is then validated by the Backend API and the Snowflake query is executed and the results are returned. We convert the results to JSON and store in a local variable.
In the requestOptions, we are setting the Request Method (GET/POST), and we are sending the accessToken in the header as a Bearer Token.
Now let us update the React UI hooks, so the newly created method is called when the page is requested. Update the useEffect() method in pages/Details.js as 6.4.7, to add the following.
fetchSalesByDOW();
Now that we have the data from the Backend API, we can build an AreaChart, to do that, we are using a react library recharts. Add the following code to pages/Details.js as 6.4.8 to display the chart.
<ResponsiveContainer width="100%" height="100%">
    <AreaChart
        width={500}
        height={400}
        data={salesByDOW}
        margin={{
            top: 10,
            right: 30,
            left: 0,
            bottom: 0,
        }}>
        <XAxis dataKey="DOW" tickFormatter={dayofWeek} />
        <YAxis tickFormatter={tickFormater} />
        <Tooltip formatter={(value) => 'US$'+(new Intl.NumberFormat('en').format(value))} />
        <Area type="monotone" dataKey="REVENUE" stroke="#548bf2" fill="#548bf2" activeDot={{ r: 8 }} />
    </AreaChart>
</ResponsiveContainer>
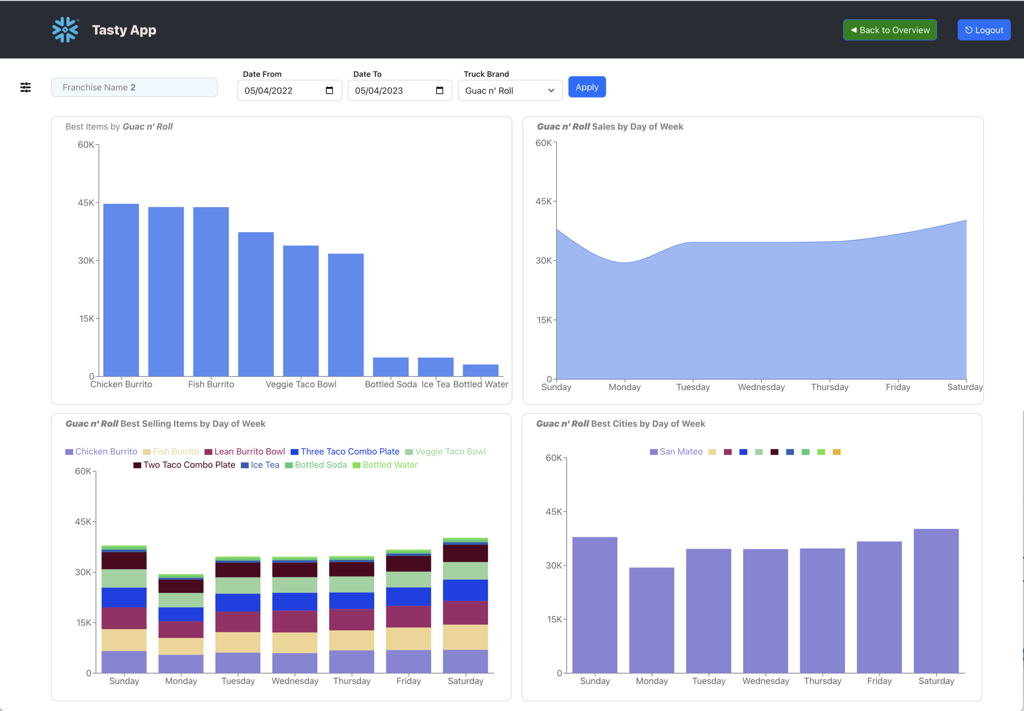
You should see the below chart displayed in your browser running the Web Application.
Lab 6.5: Use the Website.
The web application has 3 pages (Login Page, Franchise Page and Truck Details Page)
Login as User, is the way for a user to be validated and also establish a session in the Backend for the user. This is a simple page, when user enters their username and password and press Login button, user is authenticated and is navigated to the Franchise View. 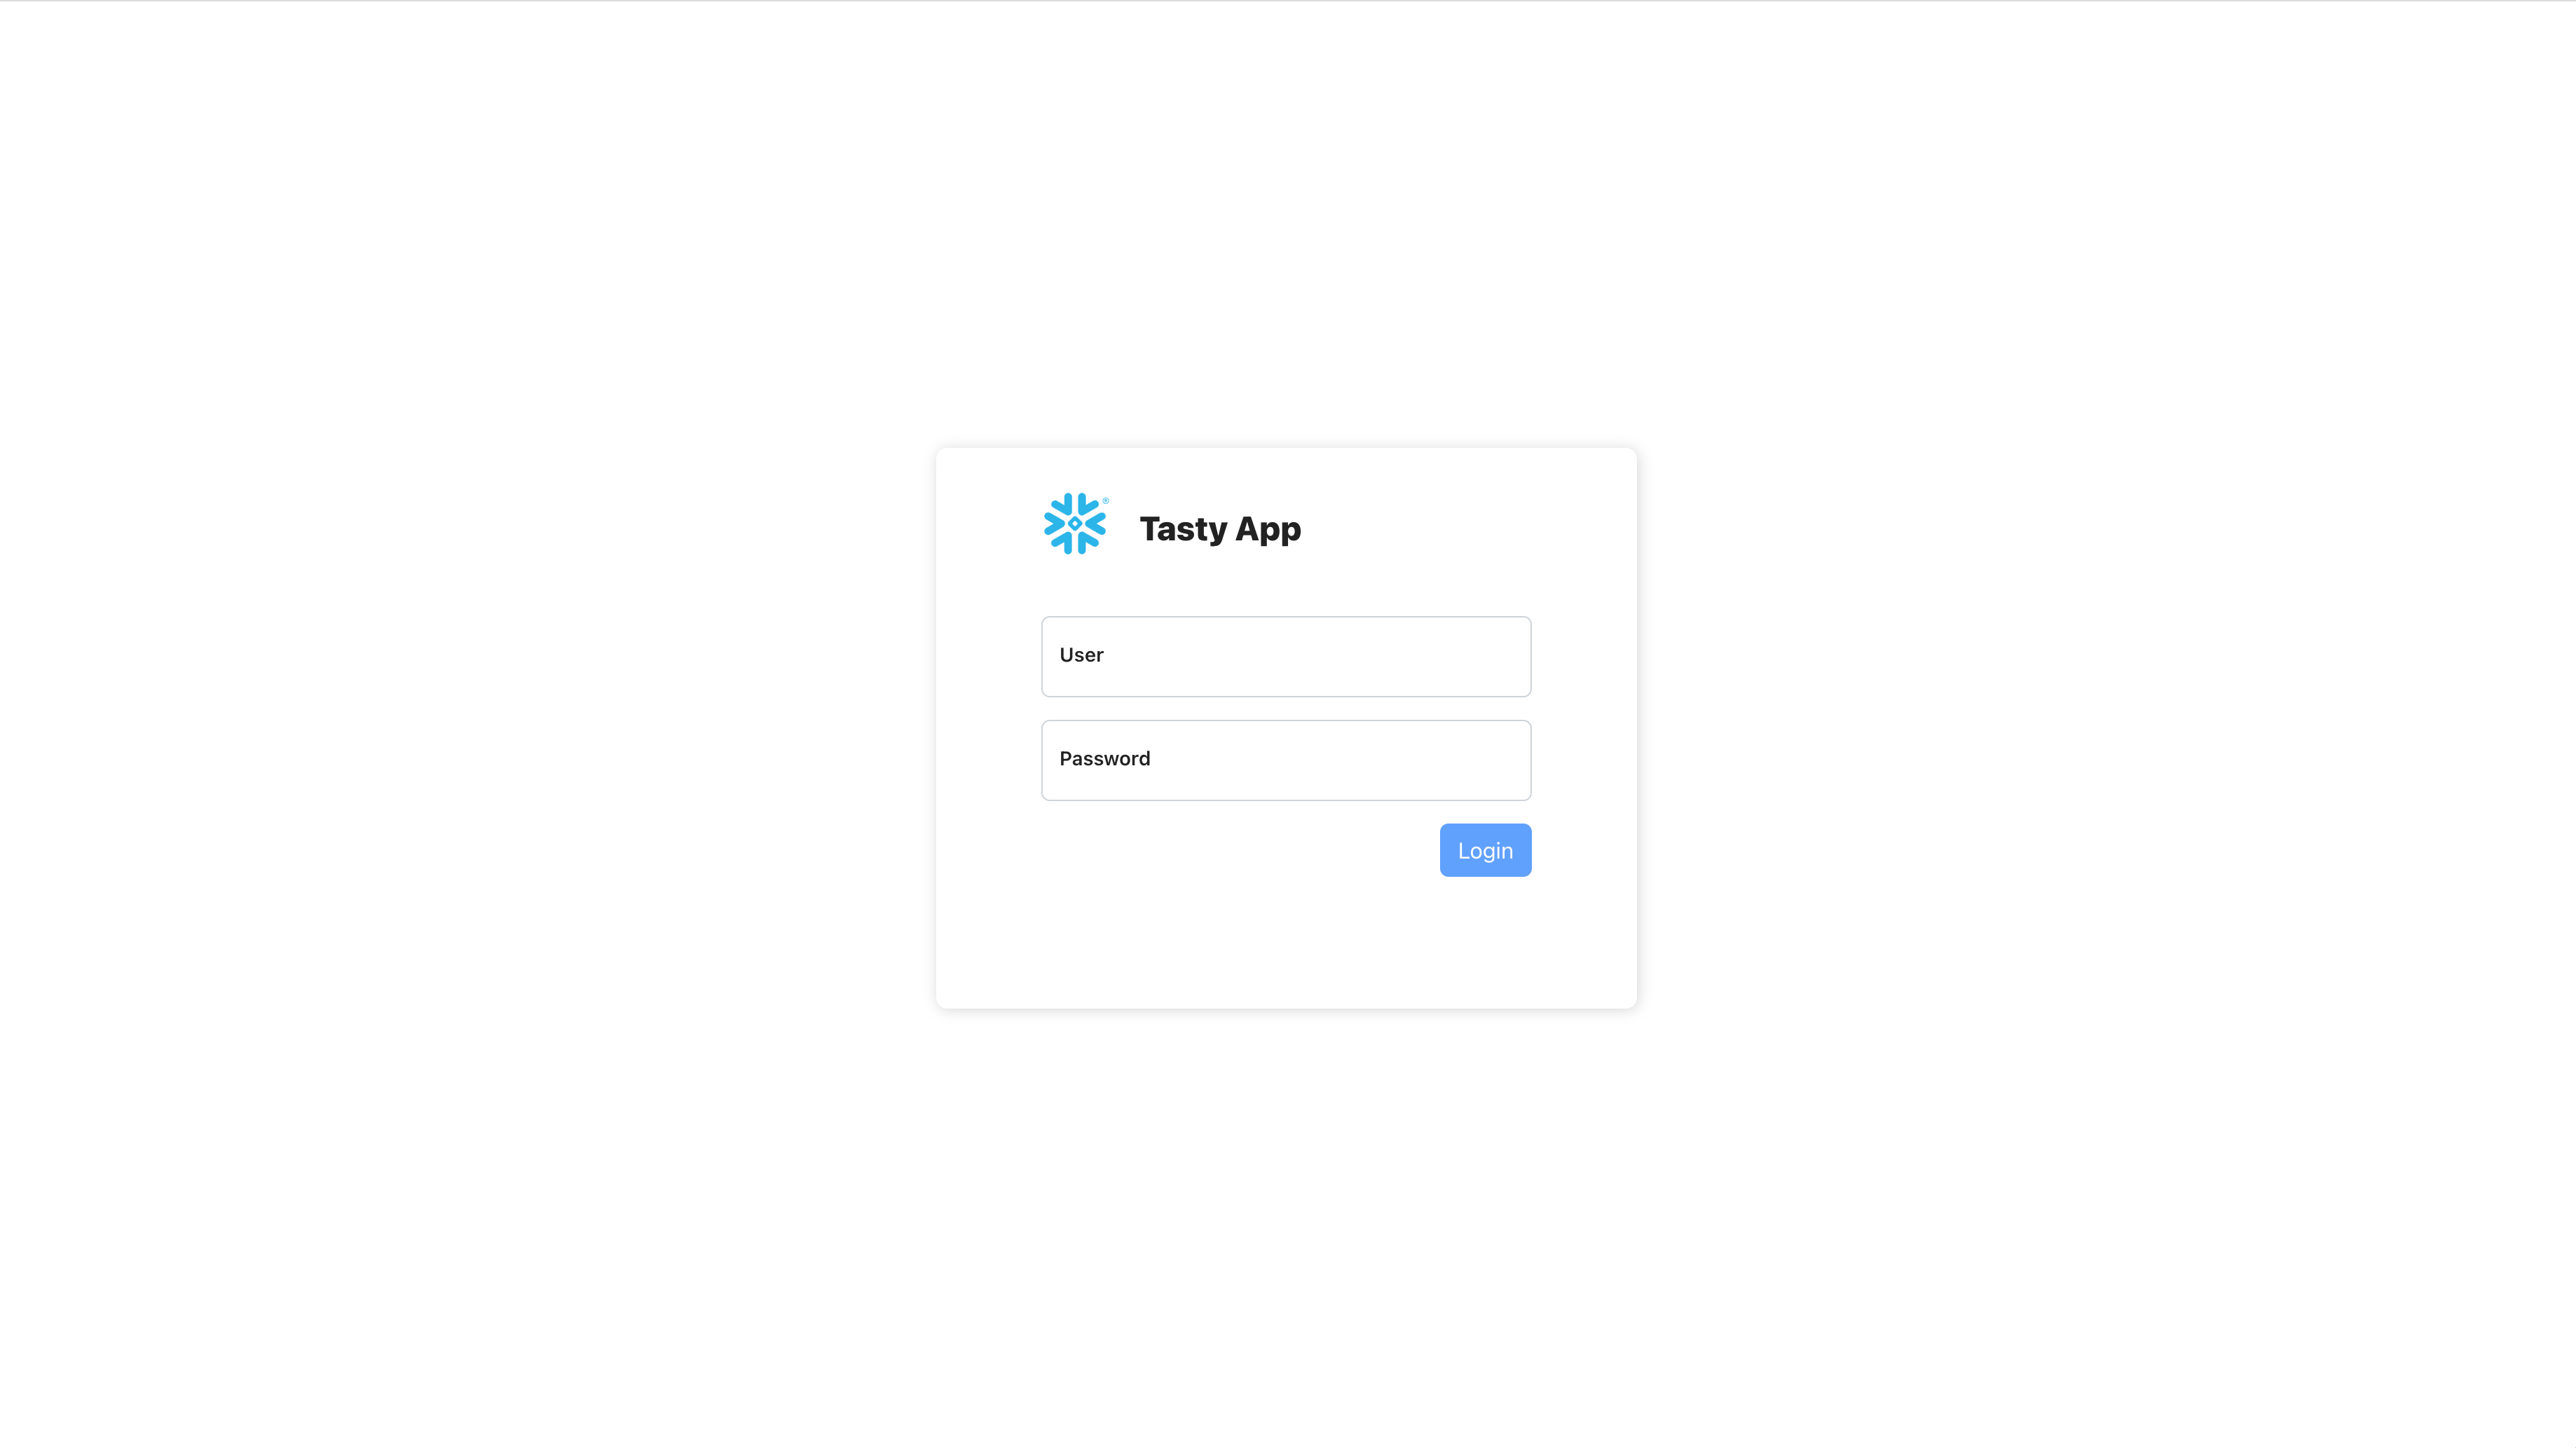
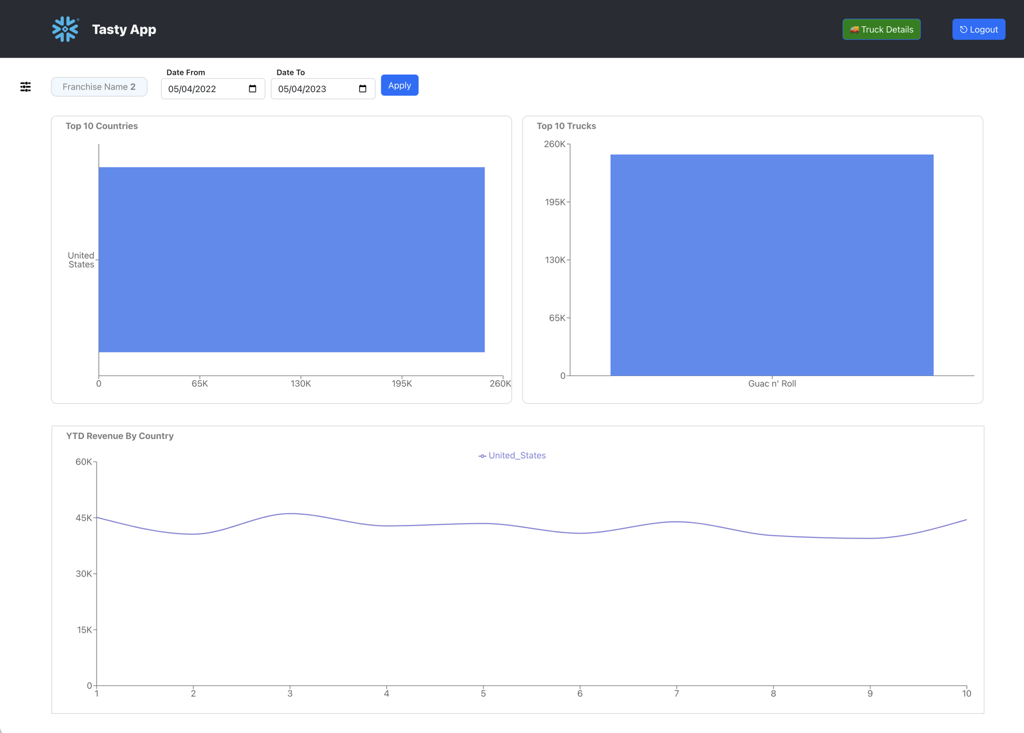
Franchise View, displays various charious charts like Sales for Top 10 Countries, Sales from Top 10 Trucks and the YTD revuenue for the Franchise. On this page, user is presented with 2 date pickers to choose Start and End Dates which are used for filtering the data.
The user can then navigate to the Truck Details page by clicking on the Truck Details button on the top right.
Truck Details View, displays various charts like Top Items, Sales by Day-of-Week, Best Sellers by Day-of-Week, Best Cities by Day-of-Week for the selected Franchise and Truck Brand. On this page, the user is presented with the same 2 date pickers from the previous page. In addition, the user has the option to choose a Truck Brand.
The user can navigate back to the Franchise page, by clicking on the Back to Overview button on the top right.
Front End
There isn't very much to clean up or tear down after this lab. When you don't need the frontend any more stop the development web server, simply by terminating the task that started the server, press Ctrl+c.
Back End
To make sure that the backend is not running any more, simply terminate the task that started the server, press Ctrl+c.
Snowflake Database
To clean up your Snowflake environment you can run the following SQL Statements.
drop database frostbyte_tasty_bytes;
drop warehouse query_wh;
drop warehouse load_wh;
drop warehouse tasty_app_api_wh;
drop user tasty_app_api_user;
drop role tasty_app_api_role;